More Facebook Ads, Better Results? The Scaling Strategy by HYPE Hyperion Digital

📈Why More Facebook Ad Campaigns Can Beat Bigger Budgets

Every advertiser eventually reaches the same point. A Facebook Ads campaign is working, CPL is stable, and leads are coming in consistently. So the obvious move seems to be increasing the budget from $50 a day to $150 and expecting the results to triple.

Sometimes it works. But it can also go the other way. CPL starts climbing, lead quality changes, and the campaign that looked efficient at $50 a day suddenly becomes much harder to manage. More spending does not always create more profitable volume because the available audience, creative, and campaign structure all have limits. 

This is where Facebook Ads scaling becomes less about simply spending more and more about choosing where the next dollar should go. At HYPE Hyperion Digital, one approach we use for local service businesses is horizontal scaling: instead of forcing one campaign to absorb all the additional budget, we create new campaigns around different angles, audiences, locations, or offers. The question is not whether vertical or horizontal scaling is always better. It is knowing when each approach makes sense. 

💰Your Best Facebook Ads Campaign Is Working — So Why Not Double the Budget?

A campaign can be profitable at one spending level without being equally profitable at a much higher one. When you increase the budget, Meta does not simply show the same ad to more of the exact same high-intent people. As the campaign spends more, it has to explore additional parts of the available audience, which can change both CPL and lead quality. 

That creates an important distinction between spending more and generating more profitable volume. Lead volume alone does not tell you whether a campaign is scaling well. If CPL rises while the quality of inquiries falls, the additional leads may not justify the additional spend.

There are two main approaches to scaling Facebook ad campaigns:

  • Vertical scaling: Increasing the budget of an existing campaign.
  • Horizontal scaling: Launching additional campaigns with different creative angles, audiences, locations, or offers.
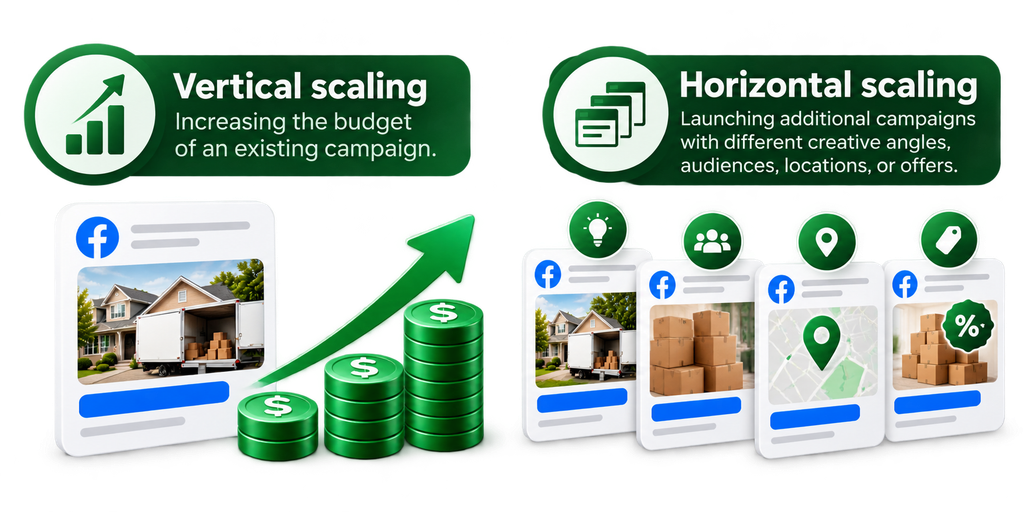
Both approaches can work. The better choice depends on the size of the audience, how the current campaign is performing, how much room it has to grow, and where the account is in its growth stage.

Key insight from HYPE Hyperion Digital: Scaling is not about choosing one method every time. It is about reading the account, understanding the market, and deciding whether the next opportunity calls for more budget behind what is already working or a new campaign that can open another path to growth.

⚖️Vertical vs. Horizontal Scaling — Two Ways to Grow Without Guesswork

Vertical scaling is the simpler approach. You take a campaign that is already working and increase its budget to try to generate more volume from the same setup. When the audience is large enough and the campaign still has room to find qualified prospects, this can be an effective way to grow.

Horizontal scaling takes a different route. Instead of asking one campaign to do more, you create another campaign with a distinct purpose. That might mean a different customer motivation, a new creative concept, another location, or a different offer. The original campaign continues running while the new campaign develops its own performance history. Pasted markdown (2)

FactorVertical ScalingHorizontal Scaling
Main approachIncrease an existing campaign’s budgetLaunch additional campaigns
Primary objectiveGenerate more volume from the current setupReach additional audience segments or opportunities
Main riskHigher CPL or declining lead quality as spend growsMore campaigns to manage and evaluate
Best suited forCampaigns with room to absorb additional spendAccounts with new angles, locations, or audiences to test

Horizontal scaling does not mean duplicating the same campaign several times and hoping the algorithm finds something new. Each campaign should have a reason to exist. The goal is to create another entry point into the market, not simply another copy of the campaign that is already running.

🚧 What Happens When You Push One Campaign Too Far?

Every Facebook ad campaign has a limit to how much it can scale efficiently. As spending increases, Meta may need to reach beyond the audience segments most likely to convert. This can lead to higher acquisition costs and fewer qualified leads per dollar spent.

Audience size plays an important role. A campaign targeting a large metropolitan area, such as Houston, generally has more room to expand than one targeting a smaller market like Maui. However, a larger population does not guarantee unlimited growth. Even in major cities, increasing a campaign’s budget from $50 to $500 per day can reduce efficiency if the most responsive prospects have already been reached.

Ad frequency is another important metric. When the same people repeatedly see the same creative, additional spending may generate more impressions without producing enough new leads. Over time, this can lead to Facebook Ads creative fatigue, where engagement declines and acquisition costs rise.
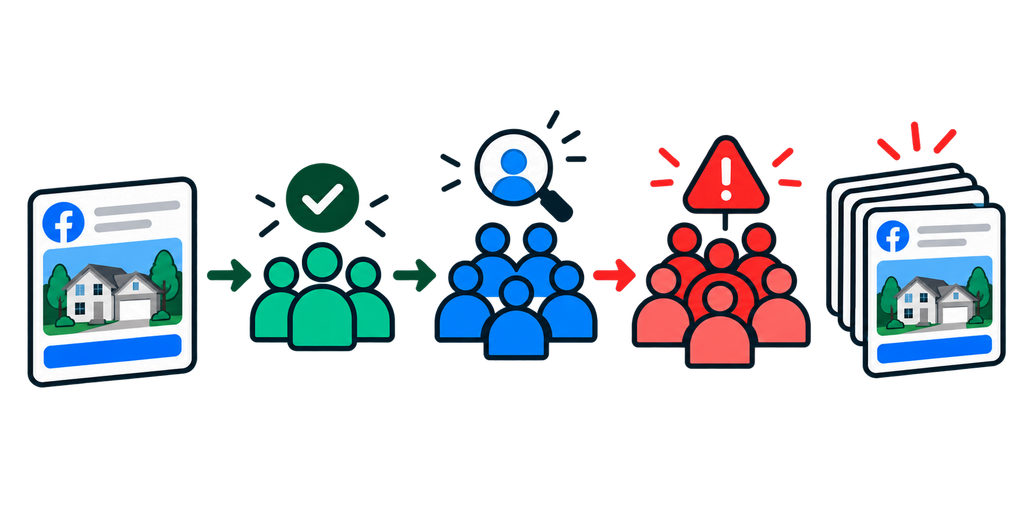
To maintain efficiency, increase budgets gradually and monitor performance after each adjustment. Raising the budget by approximately 20–25% at a time can be a useful starting point, although the appropriate pace depends on the campaign, audience size, and account performance.

The Key Takeaway: A campaign reaching its current scaling limit does not necessarily mean the market has no further potential. It may be time to introduce new creative angles, test additional audiences, or launch separate campaigns to reach new groups of qualified prospects.

🏠Six Campaigns, Six Reasons to Buy — The Attic Fanatics Case Study

Attic Fanatics in South Florida is a strong example of what horizontal scaling can look like in practice. Instead of asking one campaign to reach every homeowner with one message, HYPE Hyperion Digital ran multiple campaigns built around different customer motivations.

The reported campaign results were:

Campaign AngleLeadsCost per Lead
Savings angle1,627$38.32
FOMO savings988$35.27
Free attic sanitizing780$28.97
Spanish speakers830$25.96
Blow-in only721$28.79
Broad campaign949$36.08

Each campaign gave the same broad service a different reason to convert. The savings angle spoke to homeowners concerned about high energy bills. The FOMO savings campaign framed the savings proposition differently. The free attic sanitizing campaign focused on attic cleanliness and related concerns, while the Spanish campaign reached a Spanish-speaking audience through language-specific advertising.

The blow-in campaign focused on a specific insulation service, while the broad campaign provided a wider entry point into the market. These were not six versions of exactly the same message. They represented different reasons a potential customer might decide to take action. 

The Attic Fanatics partnership generated close to $3 million in revenue, with 10–12 campaigns running simultaneously across different angles, locations, and audience segments. The six campaigns shown above were part of that broader structure and should not be interpreted as individually responsible for a proportional share of the total revenue. 

Check our detailed work with Attic Fanatics: The Marketing Decisions That Led Insulation Company to $3M Revenue

Key insight: One service can appeal to customers for completely different reasons. Different campaign angles can create additional opportunities without requiring a new service or geographic market.

🎯When Spending More on One Campaign Actually Makes Sense

Horizontal scaling is not automatically the answer. There are situations where vertical scaling makes more sense, particularly when the existing campaign has enough audience depth to support additional spending. The first is audience size. A national campaign or large metro market with millions of potential customers may be able to absorb more budget without frequency rising too quickly. The second is the learning period. Sometimes a campaign simply needs additional spend to collect enough data, and creating another campaign would divide that learning across multiple setups.

The third situation is when the creative is consistently attracting high-intent prospects and the available audience still has room to grow. In that case, putting more budget behind the existing campaign may be the cleaner approach. P

This is where vertical scaling vs horizontal scaling should be treated as a decision rather than a fixed rule. If more spend can still reach qualified prospects efficiently, vertical scaling can work. If additional spending mainly pushes the campaign into weaker audience segments, another campaign may provide a better route to growth.

Key insight: Do not launch more campaigns simply because horizontal scaling sounds safer. Choose the approach based on actual performance signals and available audience capacity.

🗺️Four Markets, Four Budgets — How Northern Moving Systems Scaled Across Locations

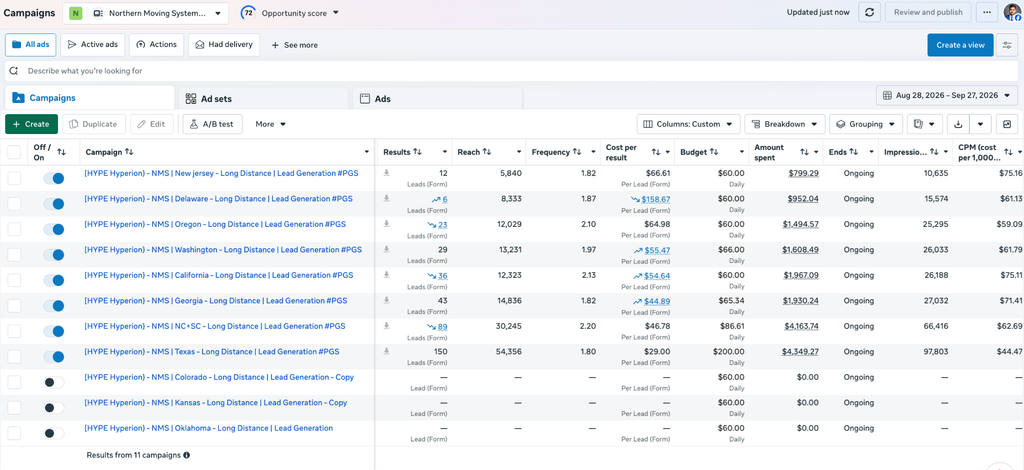
For businesses operating across several cities or states, horizontal scaling can take a geographic form. Instead of putting every location into one campaign, each market can have its own campaign, budget, and performance history. Northern Moving Systems used this approach across Texas, Georgia, North Carolina and South Carolina, and California. Each market had its own daily budget:

MarketDaily BudgetCPL
Texas$80$27.27
Georgia$60$28.53
North Carolina + South Carolina$132$32.88
California$60$34.25

The benefit was visibility. Each market produced its own cost per lead (CPL), making it easier to see where acquisition costs were lower or higher and decide where further testing might be worthwhile.
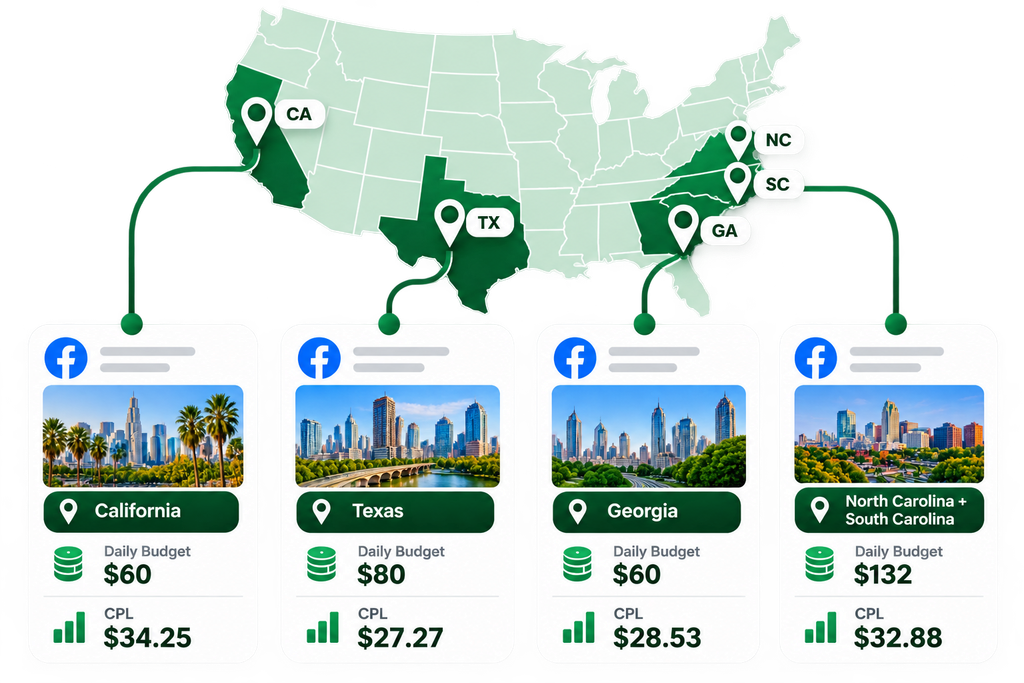
For example, Texas was at $27.27 CPL while California was at $34.25. If all four markets had been combined into one campaign, those differences would have been much harder to isolate. Separate multi-location Facebook Ads campaigns created cleaner data for market-level decisions.  That does not mean Texas was automatically more profitable simply because it had the lowest CPL. The reported figures here provide budget and CPL data, not comparable revenue or ROAS for each market. The value of the structure was the clarity it created for Facebook Ads budget optimization.

Check our detailed work with Northern Moving Systems:How HYPE Hyperion Digital Scaled Facebook Ads for Movers Across 8 States

Key insight: Combining all markets into one campaign could have obscured differences in efficiency and made budget allocation decisions less precise.

🧪One City, Two Campaigns — How EZ Home Solutions Found More Leads

Horizontal scaling does not require entering a new city. Sometimes the opportunity is sitting inside the same market but needs a different creative entry point.

EZ Home Solutions in Houston provides an example. Its original image-based campaign settled at around $41 CPL. Instead of replacing that campaign, HYPE Hyperion Digital introduced a separate campaign built around a revived November–December best-performing creative.  The new campaign ran alongside the original and generated 11 leads at $36.81 CPL in its first post-optimization run. The important part was the structure: the existing campaign was not sacrificed to make room for the new test.

This is a useful example of Meta Ads campaign optimization through an additional creative route. The new campaign gave the same Houston market another way to respond without assuming that the original campaign had to be shut down.

Key insight: Horizontal scaling can involve a new advertising concept, not just a new location or audience. The additional campaign’s initial CPL should not be treated as a permanent performance benchmark. It was an early result from the post-optimization run, not a guarantee that the campaign would remain below the original campaign over time.

🔁The Hidden Cost of Running the Same Ad Too Often

One of the biggest arguments for multiple campaigns is creative fatigue management. A campaign spending $500 a day can expose its audience to the same creative much faster than a campaign spending $50 a day. As frequency rises, people become increasingly familiar with the message. Eventually, responsiveness can fall and CPL can start moving in the wrong direction. 

This is why Facebook Ads frequency deserves attention when evaluating scaling decisions. A rising frequency does not automatically mean a campaign is failing, but when it appears alongside worsening CPL, it can signal that the current audience and creative combination is reaching its practical limit.

Introducing another campaign with a genuinely different angle can create another opportunity to connect with the audience. The goal is not to pretend that separate campaigns eliminate overlap. They do not. The goal is to diversify the advertising approach rather than relying on one creative route indefinitely.

Key insight: Creative fatigue should be evaluated using campaign data, not assumed solely from budget size. Multiple campaigns do not automatically eliminate audience overlap or guarantee lower frequency.

⚠️Three Warning Signs Your Facebook Ads Campaign Has Hit a Ceiling

There are several signals that can indicate it is time to consider a different scaling approach. None should be treated as an automatic rule, but together they can help identify when the current setup needs another entry point.

1. 📉CPL has stopped improving.

If the campaign has gone through reasonable optimization and CPL has reached a stable floor, simply adding more budget may not make the acquisition cost better. Stable CPL alone is not enough to justify horizontal scaling, though. Volume, lead quality, and downstream conversion still need to be considered.

2. 👀Ad frequency is rising.

Increasing frequency means the audience is seeing the advertising more often. If frequency continues climbing, the available audience may have limited room for additional reach within the current structure.

3. 📊More spending is not producing proportionate growth.

If the budget increases substantially but qualified lead volume does not grow at the same rate, the campaign may be experiencing diminishing returns. This is particularly important in smaller geographic markets where the available audience is finite.

Key insight from HYPE Hyperion Digital: When CPL has stopped improving and frequency is rising at the same time, consider testing a new campaign angle rather than simply pushing more budget into the existing setup. These are diagnostic signals, not automatic instructions to launch another campaign. The full funnel still needs to be reviewed before deciding what to change.

🛑The Facebook Ads Scaling Mistakes That Quietly Drain Your Budget

Scaling problems often come from treating every campaign as if it has unlimited room to grow. Common mistakes include:

  • 📈 Increasing budgets too aggressively without monitoring results. A large jump can push a campaign into less efficient audience segments and make it harder to understand what changed.
  • 🚧 Expecting one campaign to deliver unlimited growth. Every audience has practical limits, especially in local markets.
  • 🔄 Replacing profitable campaigns unnecessarily. If a campaign is still producing efficiently, there may be no reason to disrupt it simply because you want more volume.
  • 📉 Ignoring changes in CPL and lead quality. More leads are not necessarily better if acquisition costs rise and the quality of inquiries falls.
  • 🎨 Relying on one creative angle for too long. A single message can become less effective as the audience sees it repeatedly.
  • 📍 Combining locations in ways that obscure market-level performance. Blended results make it harder to see where budget is actually working.
  • 🧪 Launching duplicate campaigns without a distinct testing hypothesis. Multiple campaigns should have different purposes rather than simply competing versions of the same setup.
  • 🎯 Judging success by lead volume without evaluating business outcomes. Lead volume needs to be considered alongside quality, conversions, and the economics of the business.

These mistakes all point to the same problem: scaling without a clear reason for where the additional budget is going. A stronger paid advertising strategy treats every new campaign or budget increase as a deliberate decision rather than an automatic next step.

🚀Scale the Campaign — or Open a New Door?

The decision becomes much simpler when you look at what the existing campaign is telling you.
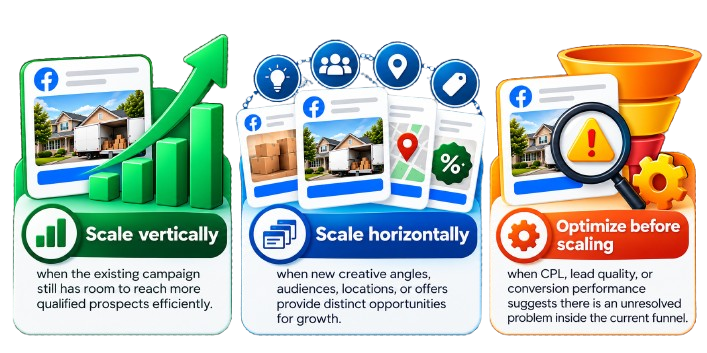
The experience across Attic Fanatics, Northern Moving Systems, and EZ Home Solutions shows why Facebook Ads scaling should not be reduced to one tactic. Attic Fanatics created additional volume by approaching the same market through different angles. Northern Moving Systems used separate location campaigns to keep market-level performance visible. EZ Home Solutions added a new creative route within the same city without replacing its original campaign. 

The real question when performance plateaus is not always “How much more money should we put into this campaign?” Sometimes the better question is “Which new door can we open for the same audience?” 

How HYPE Hyperion Digital Scaled Facebook Ads for Movers Across 8 States

📈How We Scaled Facebook Ads Across 8 States at 9x ROAS

Scaling a successful Facebook Ads campaign for moving companies takes more than increasing the budget and expanding into new markets. Early results may look promising, but performance can change as ad spend grows and new locations are introduced. The real challenge is to scale while maintaining control over lead quality, booking value, and return on ad spend (ROAS).

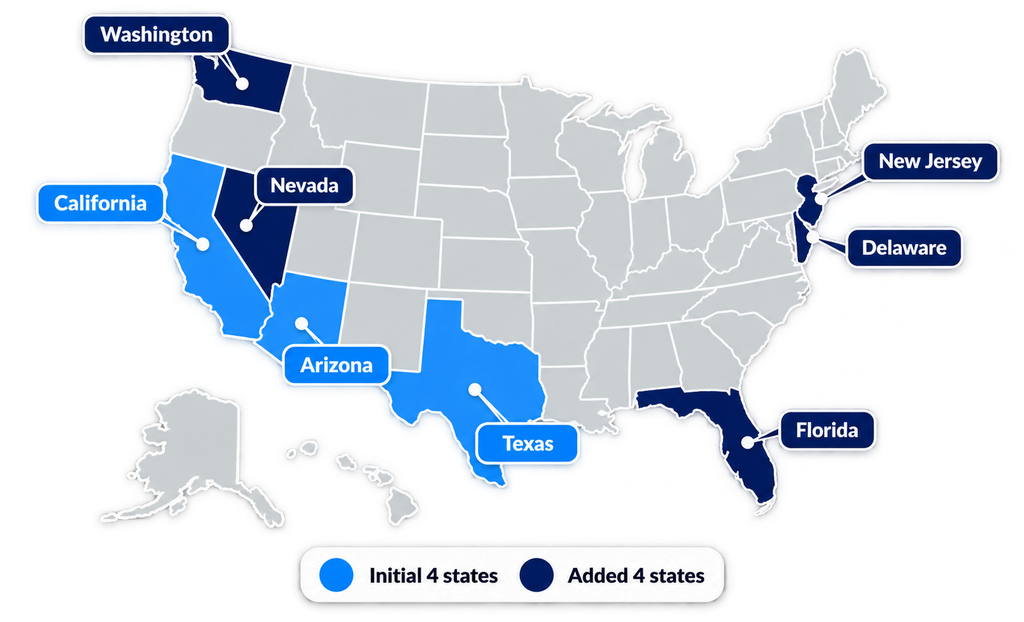
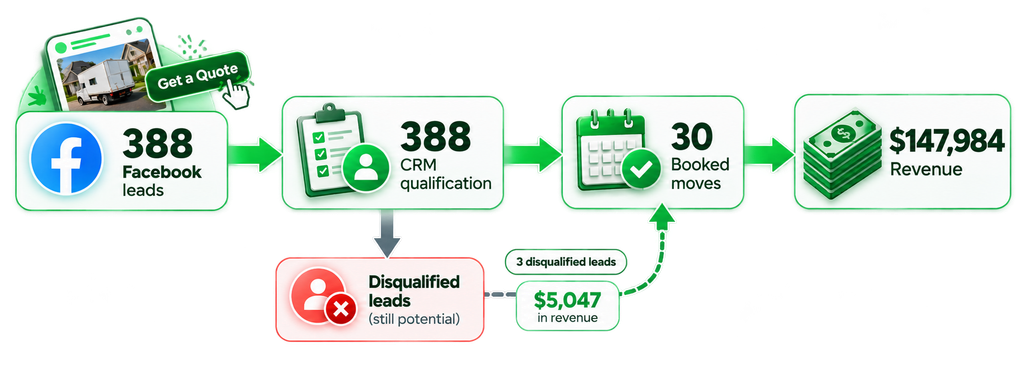
Northern Moving Systems, a long-distance moving company, approached HYPE Hyperion Digital with an established Facebook Ads campaign running across four states. We expanded the campaign to eight states while retaining the two proven video creatives, then evaluated performance over a 30-day period. The account generated 388 leads and 30 booked moves, producing $147,984 in reported booked revenue from $17,277.60 in ad spend — a reported 8.57x return on ad spend (ROAS).

Source: Northern Moving Systems

The interesting part was not simply the final number. We needed to understand which markets were producing profitable bookings, where cost per lead (CPL) was telling only part of the story, and where additional testing made sense. This case study breaks down how we approached scaling Facebook Ads across multiple locations without treating every market as if it had the same economics.

🌎Four States Worked. Could the Same Facebook Ads Strategy Handle Eight?

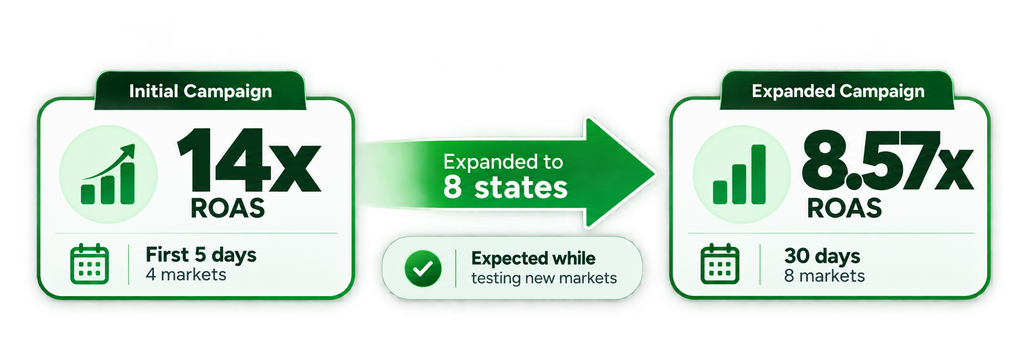
The initial campaign covered four states and used two video creatives. During the first five days, the account generated 67 leads and $28,950 in revenue at 14x ROAS. Those results gave us a strong starting point, but the next question was more important: would the strategy continue to work once the geographic footprint doubled?

Rather than replacing everything during expansion, HYPE Hyperion Digital retained the core creative strategy and added four more states. This gave us a controlled way to evaluate the new markets while keeping the existing campaigns intact. The account was then assessed across a full 30-day period to understand how the broader expansion affected Facebook Ads campaign performance.

The initial 14x ROAS and later 8.57x ROAS represent different stages and scopes of the campaign. The 14x figure came from the first five days across four markets, while the 8.57x figure reflects the expanded eight-state account over 30 days. They should not be treated as identical periods or direct like-for-like comparisons.

Key insight: Strong early results are only the beginning. The real test of a Facebook Ads for movers scaling strategy is whether it continues to generate commercially meaningful results as the account expands.

📊The 30-Day Results Behind $147,984 in Booked Revenue

Before looking at individual markets, we wanted to establish a clear picture of the account as a whole.

MetricResult
Reporting period30 days
Total leads388
Average CPL$44.52
Total clicks2,696
Advertising spend$17,277.60
Booked moves30
Booked revenue$147,984
ROAS8.57x

Based on the reported figures, the campaign generated $8.57 in booked revenue for every $1 spent on advertising. The account recorded 30 booked moves from 388 leads, representing an approximate lead-to-booking rate of 7.7%. The reported totals also imply an average booked value of approximately $4,933 per move.

That matters in the moving industry because long-distance jobs can carry substantial transaction values. A market producing fewer leads can still make sense when those leads turn into higher-value bookings. This is why profitable Facebook Ads campaigns cannot always be identified by looking at lead volume or CPL in isolation.

Key insight: Lead volume matters, but the financial value of the bookings generated by those leads determines the commercial outcome. ROAS here refers to the reported revenue generated relative to advertising spend. It should not be interpreted as net profit or as revenue after operating expenses.

🎬Two Videos, Eight States — Why We Kept the Winning Creatives

When the account expanded, we did not automatically replace the original creative. The two video concepts had already demonstrated their value across moving campaigns, so keeping them gave us a consistent creative foundation while we tested additional markets. That also made the Facebook Ads optimization process cleaner. If the creative, audience, location, and budget all changed simultaneously, it would become much harder to understand what was actually responsible for a change in performance.

💰Video 1 — The Price Transparency Angle

The first video opened with a simple message: “Stop overpaying for your move.” The creative focused on a major concern customers have when comparing moving companies: uncertainty around cost and reliability. It positioned Northern Moving Systems around a straightforward moving process from pickup to delivery, professional wrapping, and no pricing surprises.

That gave customers more than a generic reason to choose a moving company. It addressed the uncertainty behind the purchase decision: what will the move actually cost, and can the company be trusted to handle it properly? The angle was built around the concerns customers may have when comparing moving quotes, particularly the fear that an initially attractive price could turn into unexpected costs later.

⏳Video 2 — The 60-Day Urgency Angle

The second video opened with: “Moving out of state in the next 60 days? This is for you.” This creative took a different approach. Instead of leading with price, it focused on the risks of booking too late, including potentially higher costs, an unvetted crew, and having less support if something goes wrong.

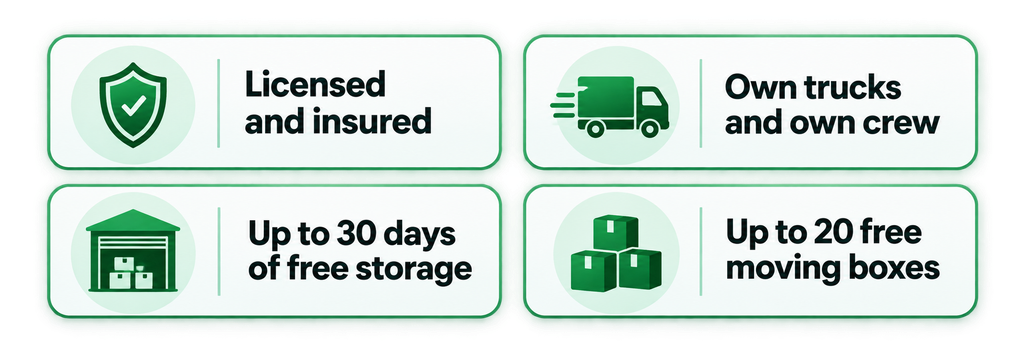
The creative also used several trust signals:

These details were designed around concerns that are particularly relevant to long-distance moves. Customers are not simply booking transportation; they are trusting a company with their belongings over a much longer journey. Key insight from HYPE Hyperion Digital: When creative concepts have already demonstrated performance across moving accounts, expansion can focus on reaching new markets rather than automatically replacing the messages that already work. The two videos were the core creative strategy retained throughout the expansion. They were not treated as the sole reason for the account’s overall revenue result.

🏆California Had a Higher CPL Than Texas — Yet Delivered the Best ROAS

This was one of the clearest lessons from the account: CPL and revenue efficiency are not the same thing.

California had a relatively high CPL, but it generated the highest ROAS in the account because its booked moves had a much higher average value. If we had made budget decisions based only on CPL, we could have incorrectly treated California as a weaker market.

MarketBooked MovesRevenueAd SpendROAS
California4$32,228$1,967.0916.38x
Texas10$40,369.27$4,349.269.28x
Washington3$13,345$1,6088.30x
Oregon2$11,355$1,494.577.60x
North Carolina + South Carolina4$29,580$4,163.747.10x
Georgia3$13,162$1,930.246.82x
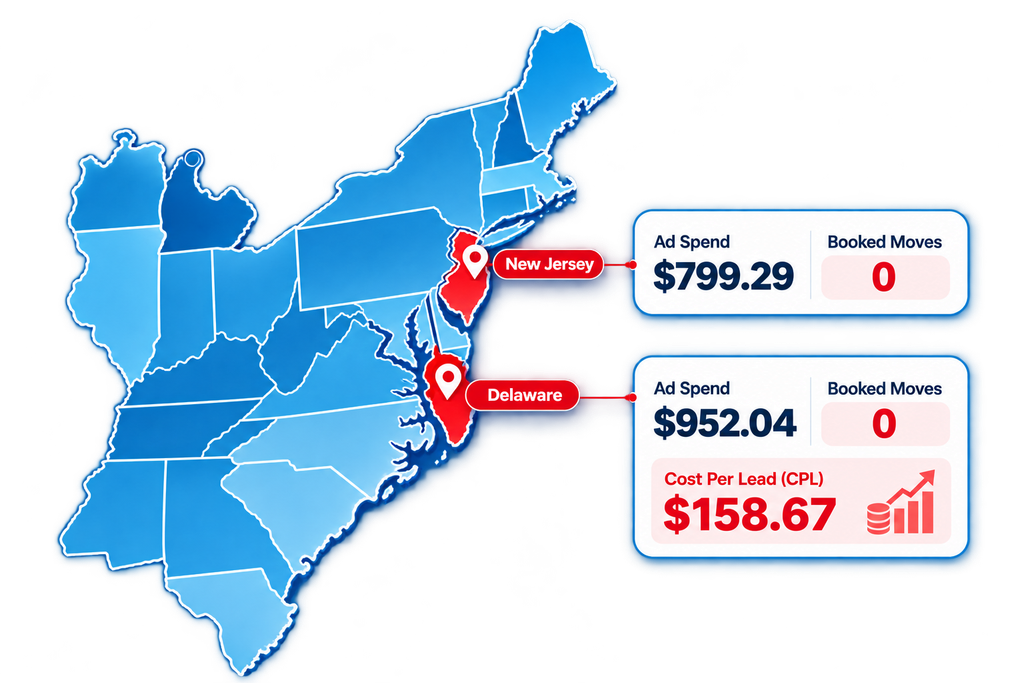
New Jersey0$0$799.29Still testing
Delaware0$0$952.04Still testing

Texas had the lowest reported CPL at $29.02 and produced the most booked moves, with 10. California had a higher CPL of $54.60, but achieved 16.38x ROAS. The average revenue per booked move also tells the story. California generated approximately $8,057 per booked move, compared with approximately $4,037 in Texas.

So while Texas was more efficient at generating leads, California was more efficient in terms of revenue returned from its advertising spend. Both numbers mattered, but they answered different questions. Key insight: CPL measures how much a lead costs. ROAS measures the revenue attributed to advertising spend. Neither should be viewed in isolation; CPL needs to be considered alongside booking rates, average job value, and revenue.

🚀Texas Was the Volume Engine — and the Strongest Candidate for More Budget

Texas stood out for a different reason. It produced 150 leads, had the lowest CPL at $29.02, and generated the highest number of booked moves at 10. The market generated $40,369.27 in reported revenue at 9.28x ROAS. That combination of lead volume, acquisition efficiency, and booked revenue made Texas the most scalable market in the account at the time of reporting.

This is where Facebook Ads budget allocation becomes more nuanced. California produced the highest ROAS, but Texas offered more volume at a lower acquisition cost. One market was stronger on revenue efficiency, while the other offered more room for additional lead and booking volume.

Key insight: The best market for additional budget is not necessarily the market with the highest ROAS. Volume, acquisition costs, booking rates, job value, and the capacity to absorb more spend should all inform allocation decisions. At that stage, Texas was the strongest candidate for additional budget. That assessment was based on the reported performance at the time and did not guarantee future results.

🔄Three Leads Marked as Disqualified Still Generated $5,047

Facebook Ads campaign performance does not stop being relevant when a lead enters the CRM. What happens after the lead arrives can materially change the final business outcome.

In this account, three leads initially flagged as disqualified eventually became booked moves. Together, those bookings generated an additional $5,047 in revenue. These were borderline opportunities that could have been discarded under a stricter qualification process. But an initial form response does not always tell the complete story. A sales conversation can reveal that a prospect is actually suitable even when the original answers do not perfectly match the qualification criteria.

That does not mean every disqualified lead should be pursued indefinitely. It means borderline opportunities deserve a closer look before being written off completely. Key insight: Advertising performance does not end when a lead enters the CRM. Lead handling, follow-up, and sales judgment can determine whether an inquiry becomes revenue.

🔍The Facebook Ads Booking That Never Appeared as a Lead

Form submissions do not capture every customer journey influenced by advertising. In this case, one booking worth $2,898.43 came through the website with Facebook listed as the referrer. The customer saw a Facebook ad, did not submit the advertising form, visited the website, and then booked directly. Because there was no advertising form submission, the booking did not appear as a lead in Ads Manager. However, Facebook advertising was still part of the reported customer journey.

This is an important consideration for paid advertising for moving companies. If performance is judged entirely by form submissions, some of the channel’s contribution may be missed. Key insight: Measuring Facebook Ads exclusively through form submissions can underestimate the channel’s contribution to business results. For a broader view, businesses should compare Ads Manager data with website referrals, booking records, and CRM data. A Facebook referrer provides useful context, but it does not prove that the ad alone caused the booking.

🧪New Jersey and Delaware Had No Bookings Yet — So Why Keep Testing?

New Jersey and Delaware were the two newly tested markets that had not generated a booked move at the time of reporting. New Jersey had $799.29 in advertising spend, while Delaware had $952.04. Delaware also recorded the highest reported CPL in the account at $158.67.

The campaigns were therefore being handled cautiously rather than receiving the same level of investment as the established markets. The team was waiting for stronger evidence of booked revenue while keeping the better-performing markets as the priority for scaling. At the same time, additional campaigns were being prepared for new states. This allowed multi-location advertising campaigns to continue testing opportunities without putting the established campaigns on hold.

Key insight: A new market should not be judged solely by the first signs of underperformance, but it should not receive unlimited spending without evidence either. The balance is important. A new market needs enough time and data to receive a fair test, but the Facebook Ads budget allocation still needs to protect the markets that are already producing results. New Jersey and Delaware had not become profitable at the reporting point. Both were still being tested without booked moves.

📉Why ROAS Fell from 14x to 8.57x — and Why That Wasn’t a Failure

The move from 14x ROAS to 8.57x can look negative if the two numbers are viewed without context. They represent different stages of the campaign and different levels of geographic coverage. The first five days produced 14x ROAS across four markets. The expanded account covered eight states, including New Jersey and Delaware, where no booked moves had been generated at the reporting point.

As the business spent money testing those unproven markets, the cost of experimentation became part of the blended account result. That naturally placed downward pressure on the overall ROAS. At the same time, the six core markets excluding New Jersey and Delaware reported ROAS values ranging from 6.82x to 16.38x. The lower blended number therefore did not automatically mean that the original campaigns had deteriorated. It also reflected the investment required to test additional markets and identify future opportunities.

Key insight from HYPE Hyperion Digital: A controlled expansion can temporarily lower blended ROAS while the business searches for its next profitable market. The important question is whether the test is being managed responsibly and whether the established campaigns remain economically strong. That does not mean every ROAS decline is healthy. In this case, the explanation is directly tied to the broader geographic expansion and the reported performance of each market.

✅What This Facebook Ads Scaling Case Study Proves

  • 📈 A strong first week must be followed by sustained performance as spending and geographic coverage increase.
  • 🎯 Proven creative angles can be retained while campaigns expand into new markets.
  • 📊 Separate location campaigns make comparison easier, allowing CPL, revenue, and ROAS to be evaluated market by market.
  • 💰 A higher CPL does not automatically indicate a weaker market.
  • 🏆 Average booking value can change which markets deserve additional investment.
  • 🤝 Borderline leads may still generate meaningful revenue when handled carefully.
  • 🔍 Website bookings influenced by advertising may not appear as form submissions in Ads Manager.
  • 🧪 New markets require controlled testing, while established winners should remain protected.
  • 📉 A lower blended ROAS during expansion does not automatically indicate campaign deterioration.

In the end, successful Facebook Ads scaling is not about maximizing lead volume or protecting one ROAS number at all costs. It is about understanding the economics of each market, putting more budget behind proven opportunities, and testing new ones without losing control of the account.

For Northern Moving Systems, expanding from four to eight states was not simply a matter of spending more. It was about knowing where the money was working, where more testing was justified, and where the numbers did not yet support additional investment. That is what turns expansion from a bigger ad account into a more disciplined growth strategy.

🚀Ready to Scale Your Facebook Ads?

Expanding into new markets takes more than increasing ad spend. It requires a clear understanding of lead quality, booking value, market-level performance, and the economics behind each campaign.

HYPE Hyperion Digital helps businesses evaluate advertising performance, identify opportunities supported by the data, and make informed decisions about budget allocation.Want to understand where your Facebook Ads budget could work harder? Contact us to discuss your campaign goals and potential growth opportunities.

Facebook Ads Market Testing Strategies from HYPE Hyperion Digital

🎯How to Test a New Market in Facebook Ads Without Burning Your Budget

Expanding into a new market can be one of the best ways to find the next growth opportunity for a business. It can also become one of the fastest ways to waste advertising spend when there is no clear testing strategy behind it.

The problem is usually not that businesses test new markets. It is that they either launch too cautiously to collect useful data or keep spending after the numbers have already shown that something needs to change. At HYPE Hyperion Digital, we have tested new markets across moving companies, home services, medical clinics, and app campaigns. The approach that consistently helps is simple: define the test before spending, isolate the market, measure more than just cost per lead (CPL), and give every result a clear next step.

🌎What Counts as a New Market?

A new market is not necessarily a new city or state. It is any audience your advertising has not yet proven itself with. That could mean a moving company expanding from four states to eight, a home service company targeting a new city, or a business entering an entirely different country.

It can also be a new language audience within the same geographic area. A Spanish-speaking audience running alongside an existing English campaign is a separate market test because the audience, messaging, creative, and follow-up experience can all behave differently.

Even platform segments can count. When Zumlist tested its app install campaigns, iOS and Android represented different opportunities that needed to be evaluated separately. The same new market testing principles apply: isolate the test, establish a baseline, measure the right signals, and decide what the data is telling you.

You can read more about our work with Zumlist in this case study: How iOS Tracking and Meta Optimization Cut App Install Costs

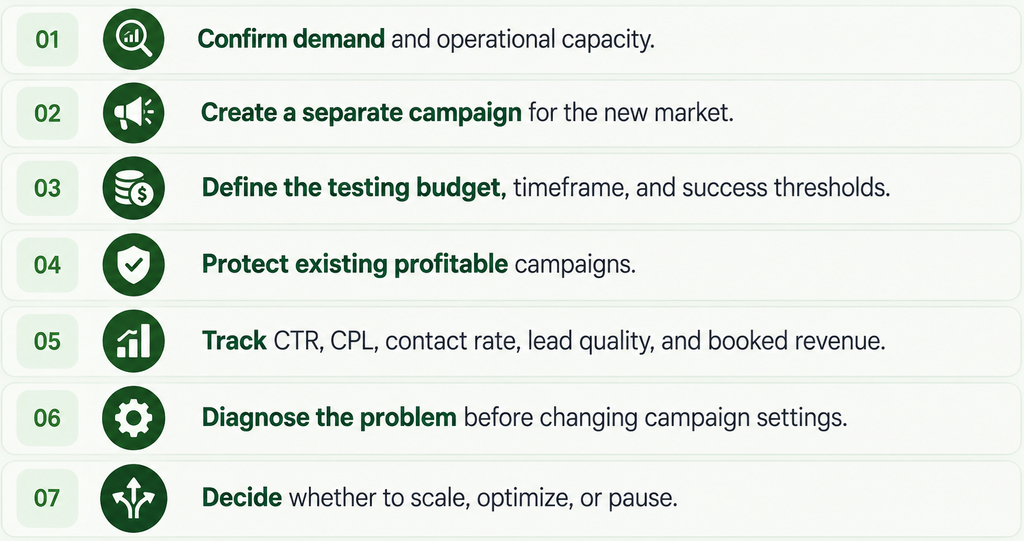
🧭How to Test a New Market: 8 Steps to Follow

1. 🔎Evaluate Market Demand Before Setting a Budget

The first question in a market expansion strategy should not be, “How much should we spend?” It should be, “Is this market worth testing in the first place?” Look at the size of the reachable audience, existing demand, population, service demand, and whether the business is already receiving inquiries from that area. Then look at operational capacity. If the company cannot support the market because of staffing, pricing, crew availability, logistics, or service limitations, more advertising will not solve the problem.

The economics matter too. A smaller market can still be attractive if customers have a high average job value. Wailea Movers is a good example. The company operates in a smaller, remote island market with an older population, so a $43 CPL can represent a strong result even though that number might look less impressive in a much larger mainland market.

You can read more about our work with Wailea Movers in this case study: How One Proven Creative Angle Revived a High-Fatigue Meta Ads Campaign

The same principle applies to Northern Moving Systems. Its California campaign produced a $54.60 CPL, but the market generated a 16.38x ROAS because the value of the resulting moving jobs made the higher lead cost commercially worthwhile. CPL gives you the cost of acquiring a lead; it does not tell you whether the market makes money. Finally, make sure the business can actually handle the audience once leads arrive. We only recommend language-specific campaigns when the client has the staff and process to follow up appropriately. A campaign targeting Spanish-speaking customers does not help if nobody on the sales team can communicate with those leads.

2. 🗂️Create a Separate Campaign for Each New Market

Once you have identified a market worth testing, isolate it. Adding a new city or region to an existing winning campaign may seem efficient, but it makes marketing campaign performance harder to read. The new market’s results become blended with the established market, making it difficult to determine where the budget is going and which location is actually responsible for the results.

Separate campaigns give each market its own budget and performance data. If one market underperforms, you can pause it without disrupting a profitable campaign elsewhere. If another market performs well, you can increase its investment without guessing how much of the existing campaign’s performance came from that location.

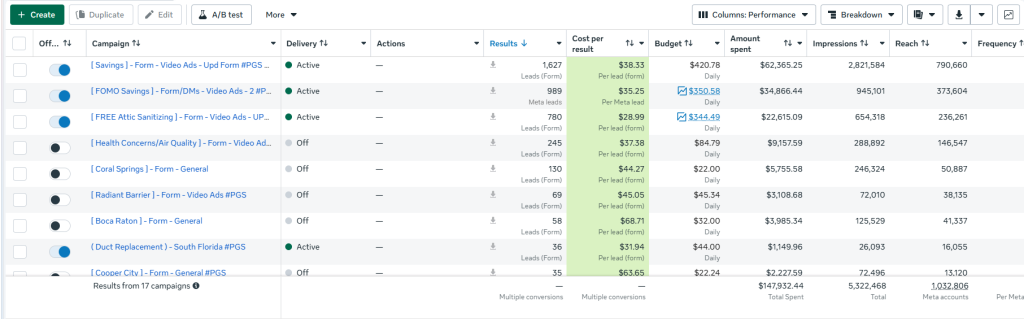
Attic Fanatics provides a useful example. Its South Florida campaigns were separated by location and angle, which allowed us to see Coral Springs producing 130 leads at a $44.27 CPL while Boca Raton was at $68.71 CPL. Instead of treating South Florida as one market, the separate campaigns showed us that individual locations were behaving differently. That cleaner data is one of the biggest advantages of a structured new market testing approach.

You can read more about our work with Attic Fanatics – South Florida in this case study: The Marketing Decisions That Led Insulation Company to $3M Revenue

3. 💰Set Your Testing Budget and Success Criteria

Before launching, decide what you are willing to spend to learn whether the market works. A paid advertising budget without predefined rules can quickly turn into an open-ended experiment. For local services, a two-to-four-week testing window is a useful starting point because leads may need time to move through the sales process. You should also establish a minimum amount of data before judging the test. We generally want at least 10–15 leads before making a serious judgment about lead quality and close rate.

Then define what success looks like. That could be a target CPL, a minimum ROAS, a booked-revenue threshold, or a combination of these metrics. The exact number will depend on the business economics, but the important part is deciding before the campaign launches. This prevents the goalposts from moving once money has been spent. If the campaign misses the threshold, you already know whether the next step is campaign optimization, a deeper diagnosis, or a pause.

4. 📈Start Small and Expand Gradually

Testing a new market does not mean launching in every possible location at once. Starting with a defined group of markets gives you enough data to learn without spreading the digital marketing budget allocation too thin. When Zumlist launched its app install campaigns, the initial focus was New York. Starting with a narrow, high-quality market made it easier to collect early data before expanding further.

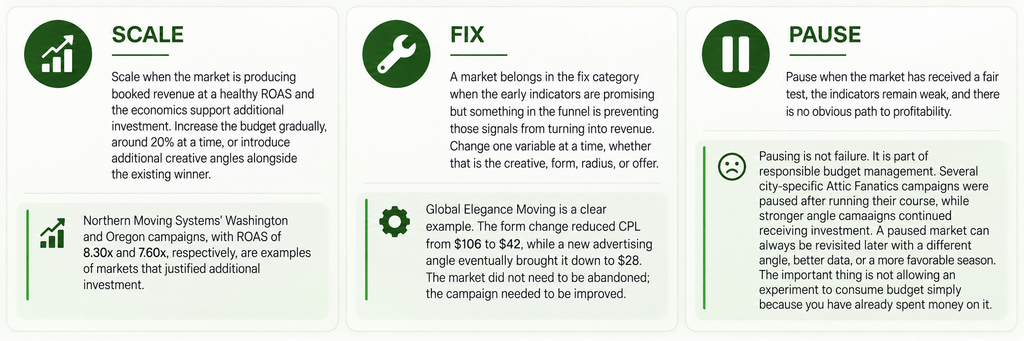
Global Elegance Moving followed a defined market approach across Georgia, New Mexico, North Carolina, and South Carolina. When the campaign initially produced a $106 CPL, the team could focus on what needed to change instead of having dozens of markets producing mixed signals. A form change reduced CPL to $42, and a new advertising angle eventually brought it down to $28. The objective is not to find the perfect market immediately. It is to identify a repeatable model in a manageable number of markets and then carry what works into the next opportunity.

5. 🛡️Protect Profitable Campaigns During Testing

New market testing should never come at the expense of campaigns that are already producing revenue. A practical starting point is to allocate roughly 10–20% of total advertising spend to experiments. This gives the new market enough room to generate meaningful data while protecting the campaigns that have already proven themselves.

Northern Moving Systems provides a useful example. When the company expanded from four states to eight, the two weakest new markets, New Jersey and Delaware, spent about $1,751 out of $17,277 in total spend. That was roughly 10% of the overall budget, while the proven markets kept their budgets intact. The principle is simple: do not pull money away from a winner just because you want to test something new. Add a controlled test budget on top, or set a firm spending cap for the experiment. That protects existing revenue while giving the business room to discover its next market.

You can read more about our work with Northern Moving Systems in this case study:How HYPE Hyperion Digital Scaled Facebook Ads for Movers Across 8 States

6. 📊Track the Right Performance Metrics in Order

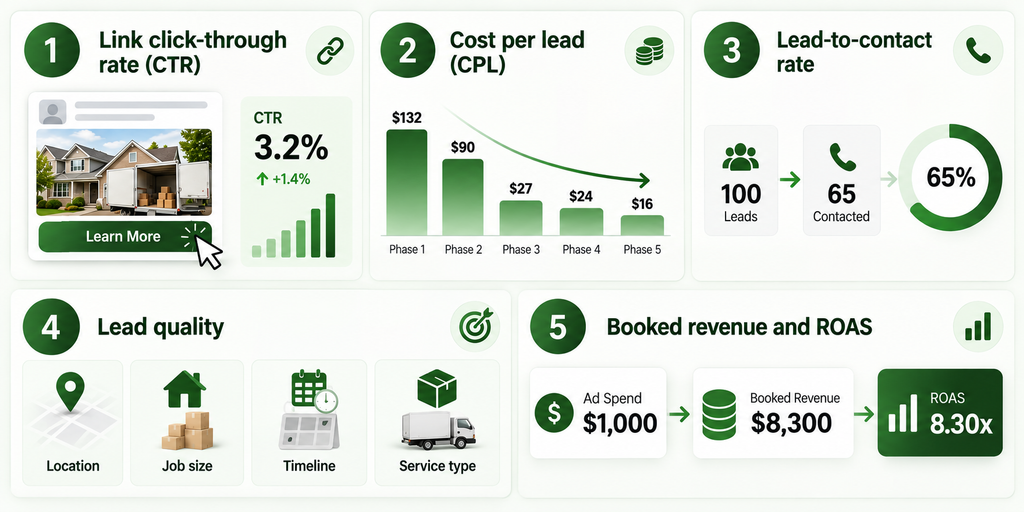
A market test should not be judged by CPL alone. Revenue is ultimately what matters, but booked revenue often takes longer to appear. The earlier indicators help you understand what is happening while the campaign is still gathering data.

1. Link click-through rate (CTR)

CTR tells you whether the advertising message is getting a response from the audience. If people are not clicking, the creative, offer, or angle may not be relevant to that particular market.

2. Cost per lead (CPL)

CPL shows how efficiently the campaign is generating inquiries and, more importantly, how that cost is trending. One expensive day does not necessarily mean the market is failing. Look at the direction across ad sets and creative changes.

Ottawa Pro Movers is a strong example. The campaign started at $132 CPL, then moved to $90, $27, $24, and eventually $16 as successive optimizations were made. The initial number looked expensive, but the trend showed that the campaign was responding to improvements.

You can read more about our work with Ottawa Pro Movers in this case study: How Better Ad Creative Reduced Lead Costs for Ottawa Pro Movers

3. Lead-to-contact rate

A cheap lead is not useful if nobody answers the phone. The contact rate helps determine whether the campaign is bringing in people who can actually be reached.

If CPL is low but a large percentage of leads never respond, the problem may be audience fit or a form that makes it too easy for unqualified people to submit their information.

4. Lead quality

Next, look at whether those inquiries actually match the service. Location, job size, timeline, and service type can tell you whether the campaign is reaching the customers the business wants.

5. Booked revenue and ROAS

This is the final commercial test. Once leads move through the sales process, booked revenue shows whether the market can support the cost of acquisition. ROAS then puts the advertising spend into the context of the revenue it generated.

A market with a higher CPL can still be a winner if customers have high enough job values. Conversely, a low CPL can hide a poor market if those leads rarely turn into revenue.

7. 🧪Diagnose Performance Problems Before Making Changes

When a new market underperforms, the first instinct is often to change the ads. That can be the wrong move. Start by identifying where the funnel is breaking. A low CTR can indicate that the message is not connecting with the audience. A healthy CTR combined with high CPL can point toward audience size, competition, or form friction. A decent CPL with no bookings shifts attention further down the funnel toward lead quality, pricing, or follow-up. 

Wailea Movers demonstrated why this distinction matters. CPL eventually climbed above $124 because the creative had stopped resonating in the small Maui market. Rather than abandoning the market, we rebuilt the angle around the specific concerns of a Maui-to-mainland move. CPL then dropped to $43. The market was not necessarily the problem; the message had become less relevant.

Northern Moving Systems showed a different pattern in New Jersey and Delaware. The campaigns had healthy CTRs of 0.97% and 0.91%, respectively, but CPL remained high and there were no bookings yet. That suggested a market-size or market-fit issue rather than an obvious creative problem. Replacing ads simply for the sake of changing something would not address the underlying issue.

Zumlist’s Android campaign was another type of test altogether. The campaign spent money without producing meaningful installs, pointing toward the platform audience rather than a straightforward creative problem. The better decision was to redirect budget toward iOS rather than endlessly tweaking the ads.

The rule is simple:

Diagnose first, change second. When you do make a change, change one meaningful variable at a time so you can understand what actually moved the result.

8. ⚖️Decide Whether to Scale, Fix, or Pause

Every market test should eventually lead to one of three decisions: scale, fix, or pause.

📚Real-World Market Testing Case Studies

The best way to understand a market testing strategy is to look at what happened when these principles were applied to real campaigns.

Business / MarketReported ResultsKey Lesson
Northern Moving Systems — California$54.60 CPL and 16.38x ROASHigher-value jobs can make a market profitable despite higher lead costs.
Attic Fanatics — Coral Springs130 leads at $44.27 CPLSeparate location campaigns reveal differences in market performance.
Attic Fanatics — Boca Raton$68.71 CPLEvaluate each location independently instead of blending results.
Ottawa Pro MoversCPL decreased from $132 to $16 after successive optimizationsA high initial CPL does not automatically mean a market should be abandoned.
Global Elegance MovingCPL decreased from $106 to $42 after a form change, then to $28 after a new advertising angleIdentify funnel friction and test changes systematically.
Wailea MoversCPL rose above $124, then returned to $43 after a localized creative changeAudience-specific messaging can resolve creative fatigue.
Northern Moving Systems — Washington and OregonROAS of 8.30x and 7.60x, respectivelySuccessful market tests can justify additional investment.
Zumlist — AndroidNo meaningful installs despite advertising spendSometimes the audience or platform is the problem, not the creative.

These examples also show why there is no single number that automatically defines a successful market. The right interpretation depends on the business model, customer value, funnel performance, and what the campaign is trying to accomplish.

⚠️Common Market Testing Mistakes That Waste Advertising Budget

The fastest way to lose control of a new market test is to remove the rules that make the test measurable. The most common mistakes include:

  • 📍 Adding new locations to existing winning campaigns. This blends the data and can disrupt campaigns that are already working.
  • 💸 Setting a budget too small to generate meaningful data. A test needs enough spend and lead volume to reveal a pattern.
  • ⏳ Pausing campaigns after only a few days. Early CPL can be volatile, so a short snapshot may not represent the market.
  • 📊 Evaluating CPL without considering job value and booked revenue. A more expensive lead can still produce better economics.
  • 🚫 Continuing to fund weak markets indefinitely. A test needs a defined point where you decide whether there is a path forward.
  • 🌐 Launching language-specific campaigns without appropriate customer support. Generating leads that the business cannot properly serve creates waste downstream.
  • 🛡️ Taking budget away from proven markets to fund experiments. Testing should create controlled risk, not put existing revenue at risk.

✅Final Checklist for Testing a New Market

Before launching a new market test, run through this checklist:

🚀Test With Rules, Not Hope

Learning how to test a new market is not about throwing a small budget at a new location and waiting to see what happens. It is about creating a controlled experiment where the business knows what it is testing, how much it is willing to spend, what signals matter, and what decision comes next.

A good market testing strategy protects the campaigns already making money while giving new opportunities enough room to prove themselves. Sometimes the answer is to scale. Sometimes the market needs a better message or funnel. And sometimes the smartest decision is to stop spending.

Test the market. Read the data. Fix what can be fixed. Scale what earns its place.