📈How We Scaled Facebook Ads Across 8 States at 9x ROAS
Scaling a successful Facebook Ads campaign takes more than increasing the budget and expanding into new markets. Early results may look promising, but performance can change as ad spend grows and new locations are introduced. The real challenge is to scale while maintaining control over lead quality, booking value, and return on ad spend (ROAS).
Northern Moving Systems, a long-distance moving company, approached HYPE Hyperion Digital with an established Facebook Ads campaign running across four states. We expanded the campaign to eight states while retaining the two proven video creatives, then evaluated performance over a 30-day period. The account generated 388 leads and 30 booked moves, producing $147,984 in reported booked revenue from $17,277.60 in ad spend — a reported 8.57x return on ad spend (ROAS).
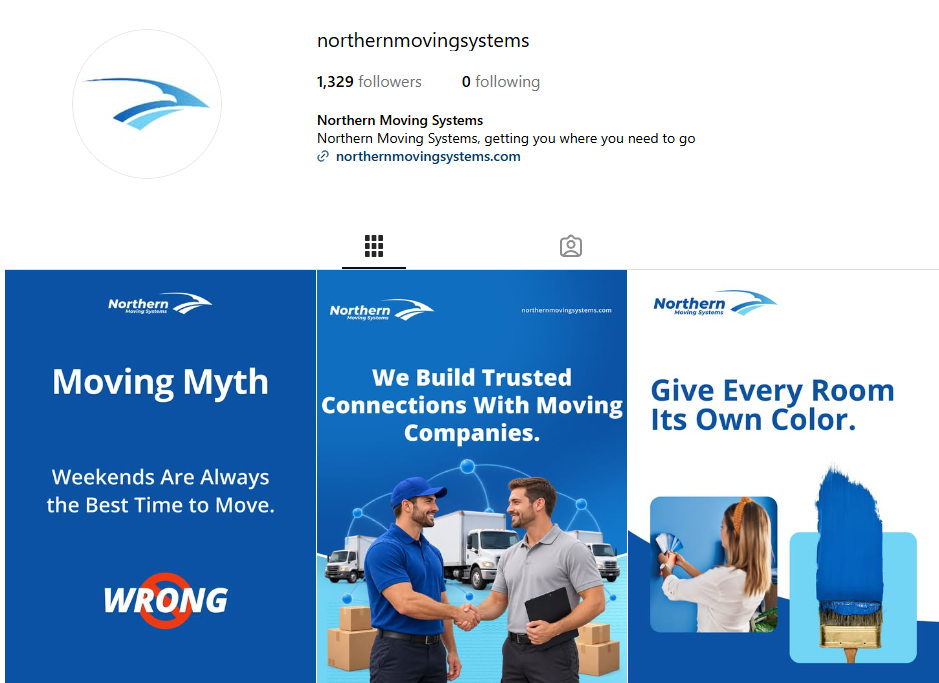
Source: Northern Moving Systems
The interesting part was not simply the final number. We needed to understand which markets were producing profitable bookings, where cost per lead (CPL) was telling only part of the story, and where additional testing made sense. This case study breaks down how we approached scaling Facebook Ads across multiple locations without treating every market as if it had the same economics.
🌎Four States Worked. Could the Same Facebook Ads Strategy Handle Eight?
The initial campaign covered four states and used two video creatives. During the first five days, the account generated 67 leads and $28,950 in revenue at 14x ROAS. Those results gave us a strong starting point, but the next question was more important: would the strategy continue to work once the geographic footprint doubled?
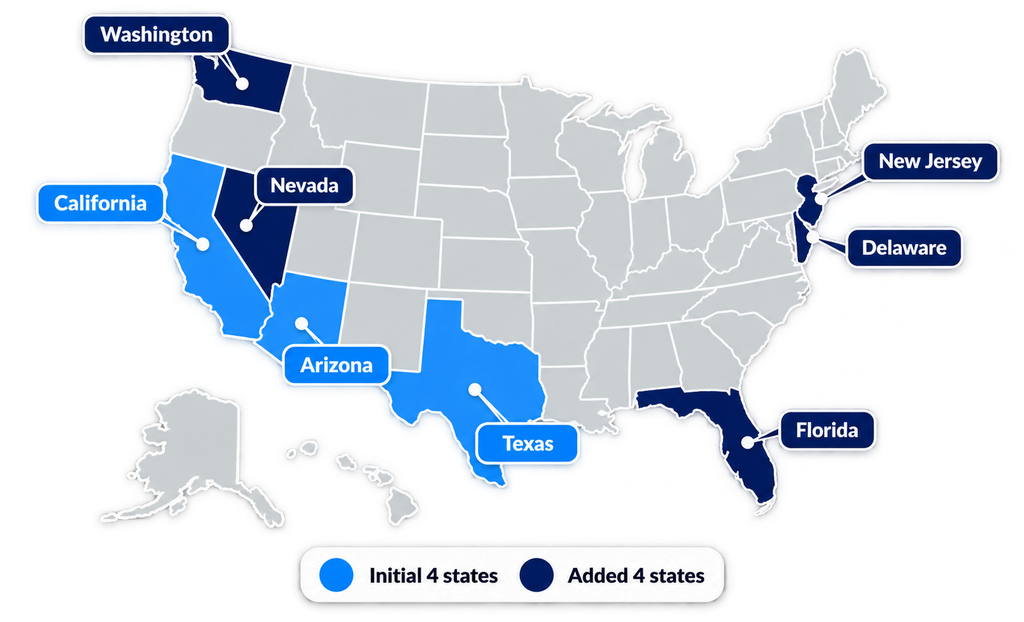
Rather than replacing everything during expansion, HYPE Hyperion Digital retained the core creative strategy and added four more states. This gave us a controlled way to evaluate the new markets while keeping the existing campaigns intact. The account was then assessed across a full 30-day period to understand how the broader expansion affected Facebook Ads campaign performance.
The initial 14x ROAS and later 8.57x ROAS represent different stages and scopes of the campaign. The 14x figure came from the first five days across four markets, while the 8.57x figure reflects the expanded eight-state account over 30 days. They should not be treated as identical periods or direct like-for-like comparisons.
Key insight: Strong early results are only the beginning. The real test of a Facebook Ads scaling strategy is whether it continues to generate commercially meaningful results as the account expands.
📊The 30-Day Results Behind $147,984 in Booked Revenue
Before looking at individual markets, we wanted to establish a clear picture of the account as a whole.
| Metric | Result |
| Reporting period | 30 days |
| Total leads | 388 |
| Average CPL | $44.52 |
| Total clicks | 2,696 |
| Advertising spend | $17,277.60 |
| Booked moves | 30 |
| Booked revenue | $147,984 |
| ROAS | 8.57x |
Based on the reported figures, the campaign generated $8.57 in booked revenue for every $1 spent on advertising. The account recorded 30 booked moves from 388 leads, representing an approximate lead-to-booking rate of 7.7%. The reported totals also imply an average booked value of approximately $4,933 per move.
That matters in the moving industry because long-distance jobs can carry substantial transaction values. A market producing fewer leads can still make sense when those leads turn into higher-value bookings. This is why profitable Facebook Ads campaigns cannot always be identified by looking at lead volume or CPL in isolation.
Key insight: Lead volume matters, but the financial value of the bookings generated by those leads determines the commercial outcome. ROAS here refers to the reported revenue generated relative to advertising spend. It should not be interpreted as net profit or as revenue after operating expenses.
🎬Two Videos, Eight States — Why We Kept the Winning Creatives
When the account expanded, we did not automatically replace the original creative. The two video concepts had already demonstrated their value across moving campaigns, so keeping them gave us a consistent creative foundation while we tested additional markets. That also made the Facebook Ads optimization process cleaner. If the creative, audience, location, and budget all changed simultaneously, it would become much harder to understand what was actually responsible for a change in performance.
💰Video 1 — The Price Transparency Angle
The first video opened with a simple message: “Stop overpaying for your move.” The creative focused on a major concern customers have when comparing moving companies: uncertainty around cost and reliability. It positioned Northern Moving Systems around a straightforward moving process from pickup to delivery, professional wrapping, and no pricing surprises.
That gave customers more than a generic reason to choose a moving company. It addressed the uncertainty behind the purchase decision: what will the move actually cost, and can the company be trusted to handle it properly? The angle was built around the concerns customers may have when comparing moving quotes, particularly the fear that an initially attractive price could turn into unexpected costs later.
⏳Video 2 — The 60-Day Urgency Angle
The second video opened with: “Moving out of state in the next 60 days? This is for you.” This creative took a different approach. Instead of leading with price, it focused on the risks of booking too late, including potentially higher costs, an unvetted crew, and having less support if something goes wrong.
The creative also used several trust signals:
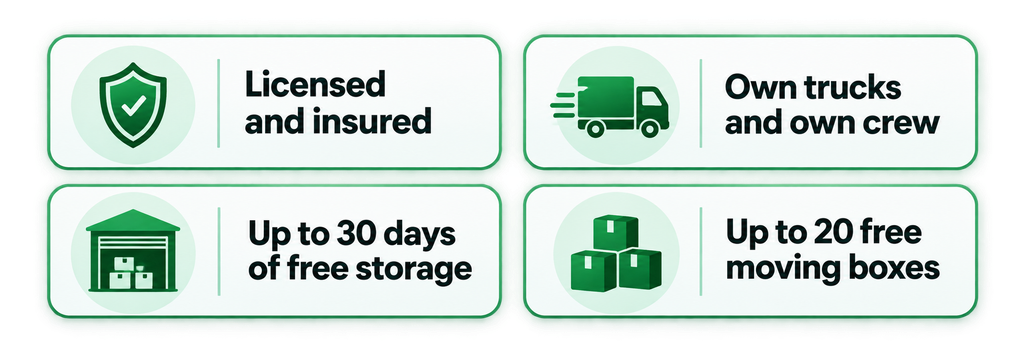
These details were designed around concerns that are particularly relevant to long-distance moves. Customers are not simply booking transportation; they are trusting a company with their belongings over a much longer journey. Key insight from HYPE Hyperion Digital: When creative concepts have already demonstrated performance across moving accounts, expansion can focus on reaching new markets rather than automatically replacing the messages that already work. The two videos were the core creative strategy retained throughout the expansion. They were not treated as the sole reason for the account’s overall revenue result.
🏆California Had a Higher CPL Than Texas — Yet Delivered the Best ROAS
This was one of the clearest lessons from the account: CPL and revenue efficiency are not the same thing.
California had a relatively high CPL, but it generated the highest ROAS in the account because its booked moves had a much higher average value. If we had made budget decisions based only on CPL, we could have incorrectly treated California as a weaker market.
| Market | Booked Moves | Revenue | Ad Spend | ROAS |
| California | 4 | $32,228 | $1,967.09 | 16.38x |
| Texas | 10 | $40,369.27 | $4,349.26 | 9.28x |
| Washington | 3 | $13,345 | $1,608 | 8.30x |
| Oregon | 2 | $11,355 | $1,494.57 | 7.60x |
| North Carolina + South Carolina | 4 | $29,580 | $4,163.74 | 7.10x |
| Georgia | 3 | $13,162 | $1,930.24 | 6.82x |
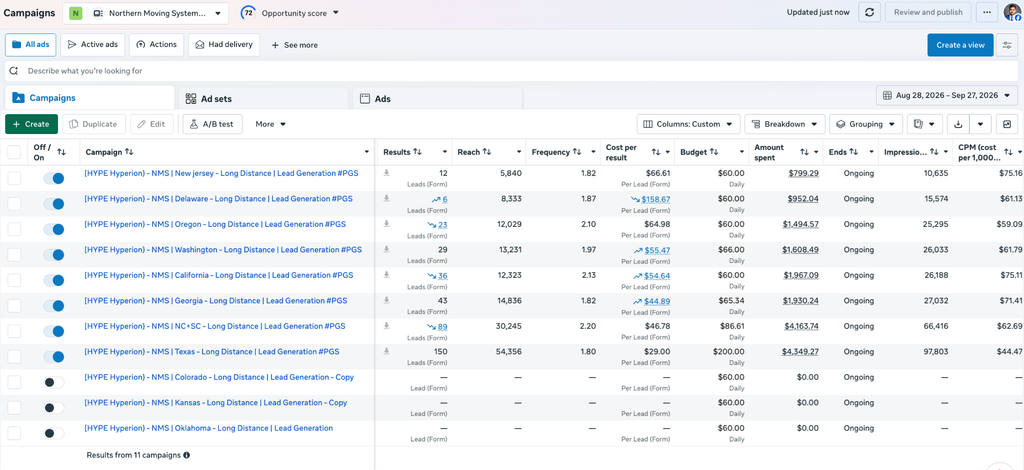
| New Jersey | 0 | $0 | $799.29 | Still testing |
| Delaware | 0 | $0 | $952.04 | Still testing |
Texas had the lowest reported CPL at $29.02 and produced the most booked moves, with 10. California had a higher CPL of $54.60, but achieved 16.38x ROAS. The average revenue per booked move also tells the story. California generated approximately $8,057 per booked move, compared with approximately $4,037 in Texas.
So while Texas was more efficient at generating leads, California was more efficient in terms of revenue returned from its advertising spend. Both numbers mattered, but they answered different questions. Key insight: CPL measures how much a lead costs. ROAS measures the revenue attributed to advertising spend. Neither should be viewed in isolation; CPL needs to be considered alongside booking rates, average job value, and revenue.
🚀Texas Was the Volume Engine — and the Strongest Candidate for More Budget
Texas stood out for a different reason. It produced 150 leads, had the lowest CPL at $29.02, and generated the highest number of booked moves at 10. The market generated $40,369.27 in reported revenue at 9.28x ROAS. That combination of lead volume, acquisition efficiency, and booked revenue made Texas the most scalable market in the account at the time of reporting.
This is where Facebook Ads budget allocation becomes more nuanced. California produced the highest ROAS, but Texas offered more volume at a lower acquisition cost. One market was stronger on revenue efficiency, while the other offered more room for additional lead and booking volume.
Key insight: The best market for additional budget is not necessarily the market with the highest ROAS. Volume, acquisition costs, booking rates, job value, and the capacity to absorb more spend should all inform allocation decisions. At that stage, Texas was the strongest candidate for additional budget. That assessment was based on the reported performance at the time and did not guarantee future results.
🔄Three Leads Marked as Disqualified Still Generated $5,047
Facebook Ads campaign performance does not stop being relevant when a lead enters the CRM. What happens after the lead arrives can materially change the final business outcome.
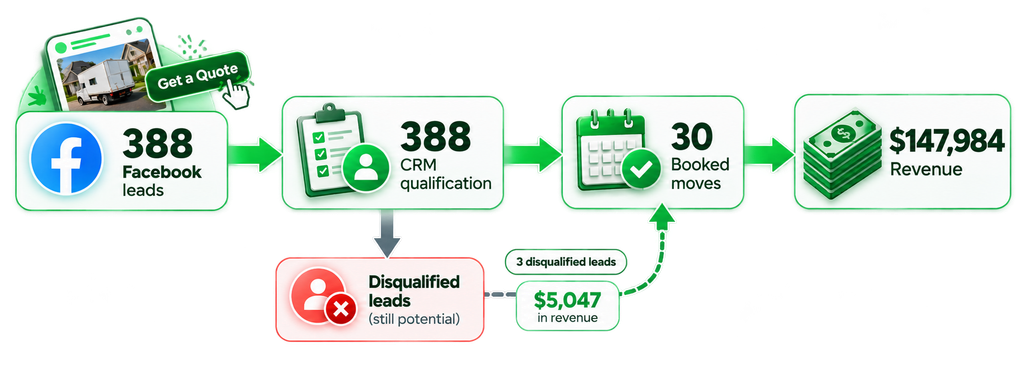
In this account, three leads initially flagged as disqualified eventually became booked moves. Together, those bookings generated an additional $5,047 in revenue. These were borderline opportunities that could have been discarded under a stricter qualification process. But an initial form response does not always tell the complete story. A sales conversation can reveal that a prospect is actually suitable even when the original answers do not perfectly match the qualification criteria.
That does not mean every disqualified lead should be pursued indefinitely. It means borderline opportunities deserve a closer look before being written off completely. Key insight: Advertising performance does not end when a lead enters the CRM. Lead handling, follow-up, and sales judgment can determine whether an inquiry becomes revenue.
🔍The Facebook Ads Booking That Never Appeared as a Lead
Form submissions do not capture every customer journey influenced by advertising. In this case, one booking worth $2,898.43 came through the website with Facebook listed as the referrer. The customer saw a Facebook ad, did not submit the advertising form, visited the website, and then booked directly. Because there was no advertising form submission, the booking did not appear as a lead in Ads Manager. However, Facebook advertising was still part of the reported customer journey.
This is an important consideration for paid advertising for moving companies. If performance is judged entirely by form submissions, some of the channel’s contribution may be missed. Key insight: Measuring Facebook Ads exclusively through form submissions can underestimate the channel’s contribution to business results. For a broader view, businesses should compare Ads Manager data with website referrals, booking records, and CRM data. A Facebook referrer provides useful context, but it does not prove that the ad alone caused the booking.
🧪New Jersey and Delaware Had No Bookings Yet — So Why Keep Testing?
New Jersey and Delaware were the two newly tested markets that had not generated a booked move at the time of reporting. New Jersey had $799.29 in advertising spend, while Delaware had $952.04. Delaware also recorded the highest reported CPL in the account at $158.67.
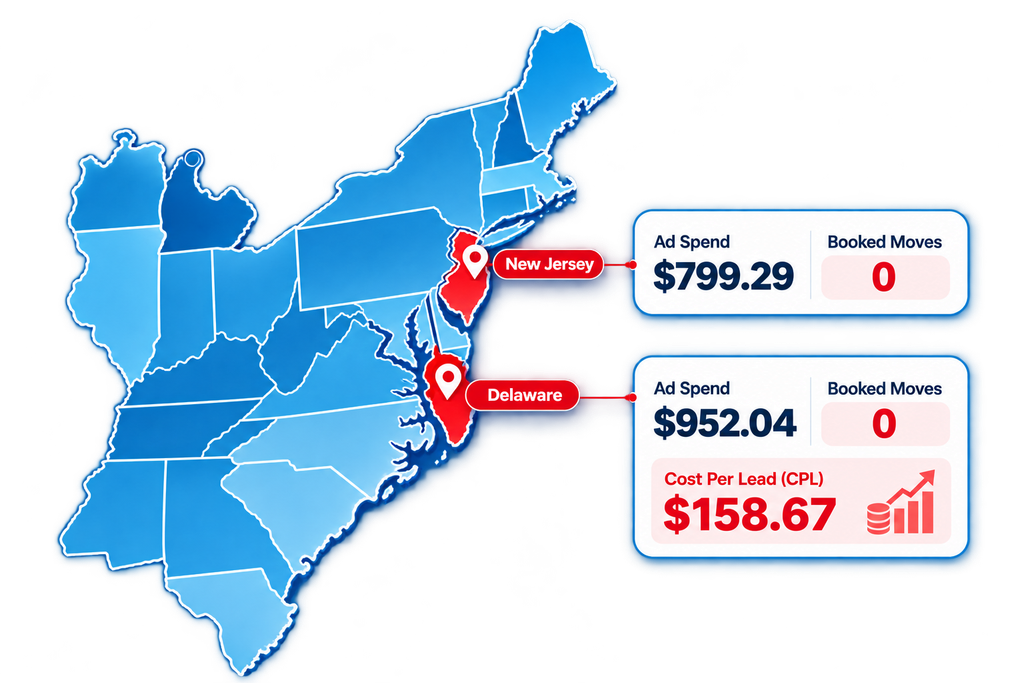
The campaigns were therefore being handled cautiously rather than receiving the same level of investment as the established markets. The team was waiting for stronger evidence of booked revenue while keeping the better-performing markets as the priority for scaling. At the same time, additional campaigns were being prepared for new states. This allowed multi-location advertising campaigns to continue testing opportunities without putting the established campaigns on hold.
Key insight: A new market should not be judged solely by the first signs of underperformance, but it should not receive unlimited spending without evidence either. The balance is important. A new market needs enough time and data to receive a fair test, but the Facebook Ads budget allocation still needs to protect the markets that are already producing results. New Jersey and Delaware had not become profitable at the reporting point. Both were still being tested without booked moves.
📉Why ROAS Fell from 14x to 8.57x — and Why That Wasn’t a Failure
The move from 14x ROAS to 8.57x can look negative if the two numbers are viewed without context. They represent different stages of the campaign and different levels of geographic coverage. The first five days produced 14x ROAS across four markets. The expanded account covered eight states, including New Jersey and Delaware, where no booked moves had been generated at the reporting point.
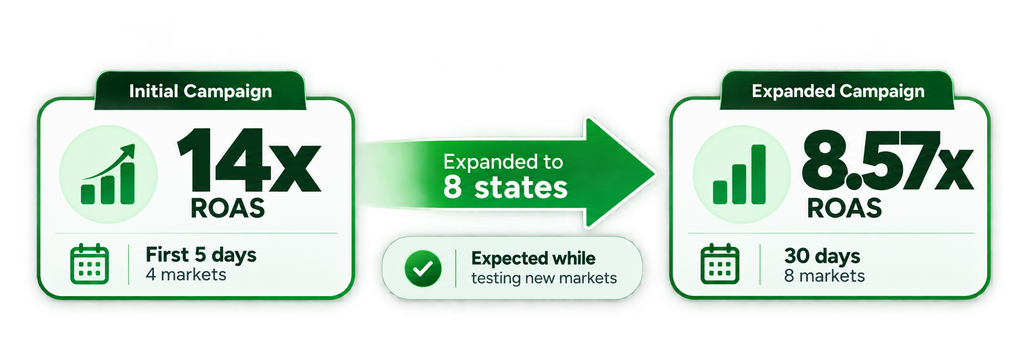
As the business spent money testing those unproven markets, the cost of experimentation became part of the blended account result. That naturally placed downward pressure on the overall ROAS. At the same time, the six core markets excluding New Jersey and Delaware reported ROAS values ranging from 6.82x to 16.38x. The lower blended number therefore did not automatically mean that the original campaigns had deteriorated. It also reflected the investment required to test additional markets and identify future opportunities.
Key insight from HYPE Hyperion Digital: A controlled expansion can temporarily lower blended ROAS while the business searches for its next profitable market. The important question is whether the test is being managed responsibly and whether the established campaigns remain economically strong. That does not mean every ROAS decline is healthy. In this case, the explanation is directly tied to the broader geographic expansion and the reported performance of each market.
✅What This Facebook Ads Scaling Case Study Proves
- 📈 A strong first week must be followed by sustained performance as spending and geographic coverage increase.
- 🎯 Proven creative angles can be retained while campaigns expand into new markets.
- 📊 Separate location campaigns make comparison easier, allowing CPL, revenue, and ROAS to be evaluated market by market.
- 💰 A higher CPL does not automatically indicate a weaker market.
- 🏆 Average booking value can change which markets deserve additional investment.
- 🤝 Borderline leads may still generate meaningful revenue when handled carefully.
- 🔍 Website bookings influenced by advertising may not appear as form submissions in Ads Manager.
- 🧪 New markets require controlled testing, while established winners should remain protected.
- 📉 A lower blended ROAS during expansion does not automatically indicate campaign deterioration.
In the end, successful Facebook Ads scaling is not about maximizing lead volume or protecting one ROAS number at all costs. It is about understanding the economics of each market, putting more budget behind proven opportunities, and testing new ones without losing control of the account.
For Northern Moving Systems, expanding from four to eight states was not simply a matter of spending more. It was about knowing where the money was working, where more testing was justified, and where the numbers did not yet support additional investment. That is what turns expansion from a bigger ad account into a more disciplined growth strategy.
🚀Ready to Scale Your Facebook Ads?
Expanding into new markets takes more than increasing ad spend. It requires a clear understanding of lead quality, booking value, market-level performance, and the economics behind each campaign.
HYPE Hyperion Digital helps businesses evaluate advertising performance, identify opportunities supported by the data, and make informed decisions about budget allocation.Want to understand where your Facebook Ads budget could work harder? Contact us to discuss your campaign goals and potential growth opportunities.