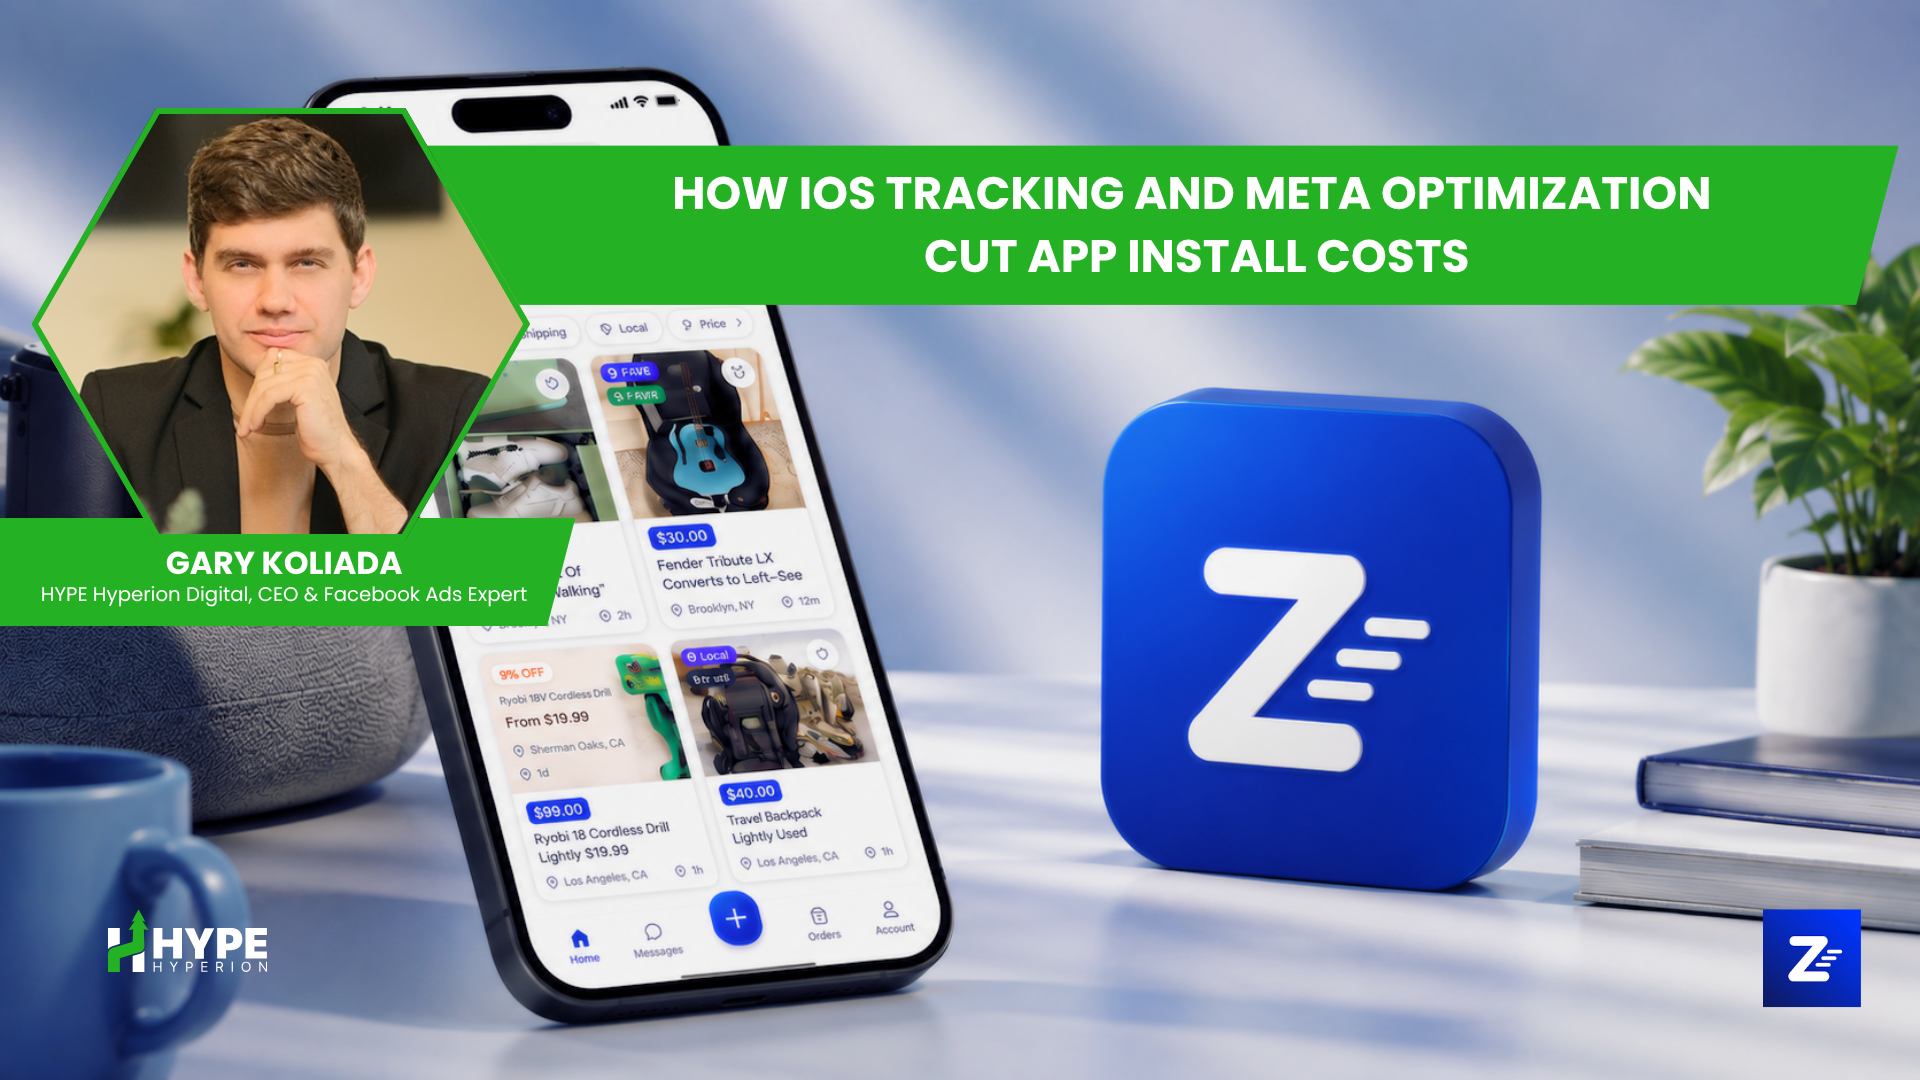
📱How iOS Tracking and Meta Optimization Cut App Install Costs
Zumlist came to HYPE Hyperion Digital with a clear goal: launch a meta app install campaign that could drive real installs in New York without wasting budget on poor tracking or weak creative signals. The campaign was not just about lowering cost per install (CPI); it was about building a campaign optimization process that helped Meta understand who was installing, which platform was worth scaling, and which message actually moved the audience.
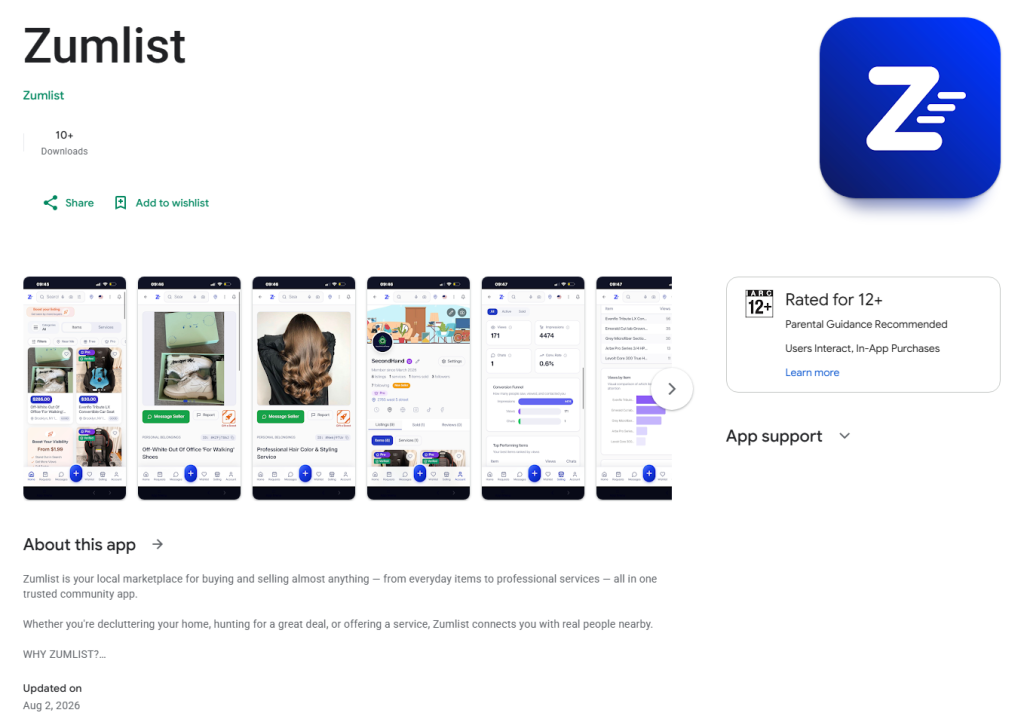
Zumlist is a marketplace app where people can buy, sell, browse, list, and book locally. That made the campaign structurally different from a single-purpose app install because we were not speaking to one simple user type. We had buyers looking for local services, sellers trying to reach customers, and everyday users who needed a reason to try a new marketplace instead of defaulting to familiar platforms.
This case study breaks down the decisions that shaped the campaign: technical setup, iOS tracking, Android testing, audience segmentation, creative testing, budget consolidation, and Meta’s own algorithmic signals. Each stage helped reduce the install cost, improve performance, and create a stronger framework for future scaling.
🛍️Launching a Marketplace App Meant Solving More Than Just User Acquisition
With a single-purpose app, the value proposition fits in one sentence. With a marketplace, you are selling different things to different people at the same time. If you are advertising a fitness tracker, a meal planner, or a photo editing app, the user value is usually simple to explain. With Zumlist, the value depends on who is using the app and what they want from it.
The campaign had two core audiences:
- The first audience was buyers. These were people looking for local services, useful listings, affordable options, and a faster way to find what they needed nearby. Their main question was simple: “Is this better than what I already use?”
- The second audience was sellers and service providers. These people cared about visibility, convenience, and getting in front of local buyers without the friction of traditional platforms. Their question was different: “Can this app help me sell, list, or get booked more easily?”

That is why audience segmentation mattered from the start. Buyers and sellers may use the same application, but they do not respond to the same promise. New York was the right launch market because nowhere else packs buyers, sellers, and service providers that close together — which is exactly what a local marketplace needs to prove it works.
📊Every Successful Campaign Starts With Data You Can Actually Trust
Before the campaign could scale, the technical setup had to work. HYPE Hyperion Digital implemented the Meta SDK for both iOS and Android so installs could be properly tracked and attributed back to the campaign. This was not optional. It was the foundation for every optimization decision that followed.
If conversion tracking is broken, Meta cannot learn properly. The campaign may still spend, but the algorithm has no clean signal about which users are actually installing the app. That creates bad optimization because Meta starts making delivery decisions based on incomplete or unreliable data.
The iOS setup was especially important. It took more effort to get right because iOS tracking often creates more friction, and many advertisers either skip it entirely or ship with broken attribution and hope for the best. That would have been a serious mistake here because a large share of the US app audience uses iPhone, especially in a launch market like New York.
So before a dollar went to delivery, tracking had to be clean enough for every install to teach the algorithm something useful. Every install needed to be readable, attributable, and useful for Meta’s learning system. Once that was in place, the campaign had something solid to optimize around instead of guessing from surface-level metrics.
🍎Why iOS Became the Clear Choice After the First Campaign Results
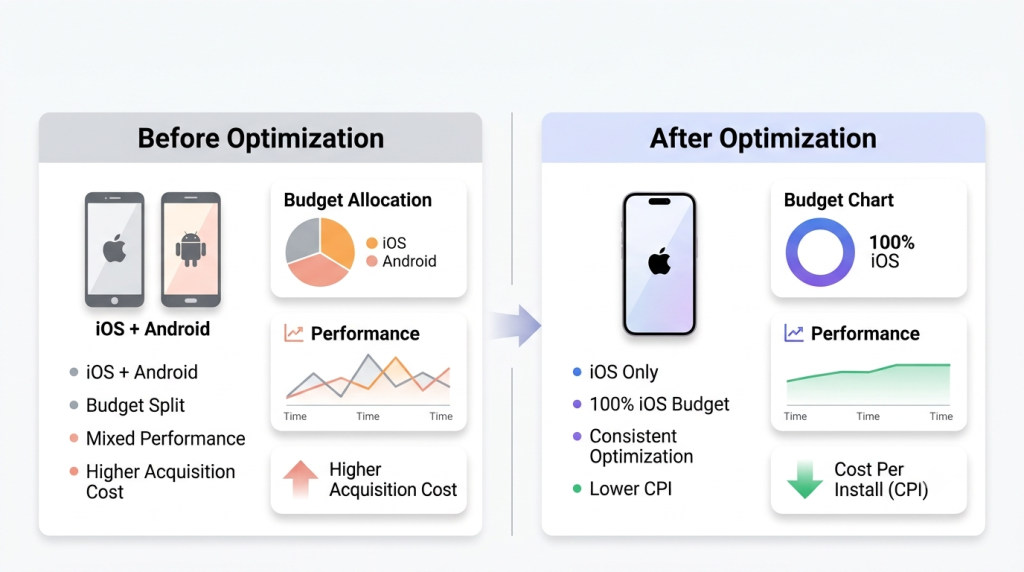
The campaign launched across both platforms: iOS App Store and Android Google Play Store. This gave us an early read on where the budget should go instead of making assumptions before the data came in.
The Android campaign spent $54.05 and returned nothing worth building on. That was enough to show that Android was not the right place to keep pushing at this stage. The issue was not only creative or targeting; it was also platform fit, market share, and user behavior.
In the US market, iOS was the better bet for early adoption. Android represents a smaller share of the audience, and within that audience, the users were less likely to act like early adopters for a new local marketplace app. Once the data confirmed that, Android was paused and the budget was redirected toward iOS.
That decision immediately improved campaign efficiency. The iOS app install campaign had cleaner signals, better install performance, and a clearer path to scaling. Instead of splitting spend across platforms for the sake of coverage, we followed the data and focused budget where the app install cost made sense.
🎯Speaking to Buyers and Sellers With Different Messages
Buyers and sellers needed different messages because they were looking for different outcomes. A buyer wants convenience, local access, better prices, and a faster way to find something useful. A seller wants visibility, easier listing, and a way to reach people who are ready to buy or book.
An ad that tries to speak to buyers and sellers at the same time ends up speaking clearly to neither. If an ad says “find local services” and “sell your services” at the same time, neither side feels like the ad was made specifically for them. That is why creative testing had to separate the buyer and seller perspective.
This made the creative optimization process much cleaner. Each ad had one job and one intended audience. That helped Meta understand who was responding and gave the campaign stronger signals around which value proposition was actually driving installs.
🎨Five Creative Directions We Tested Before Finding the Winner
Competitor research showed that strong marketplace app creatives usually lean into one clear communication style. So instead of producing five versions of the same ad, HYPE Hyperion Digital tested five different creative directions: Meme, Product Demo, Aspirational, Price-Based, and FOMO/Direct.
😂Meme creative
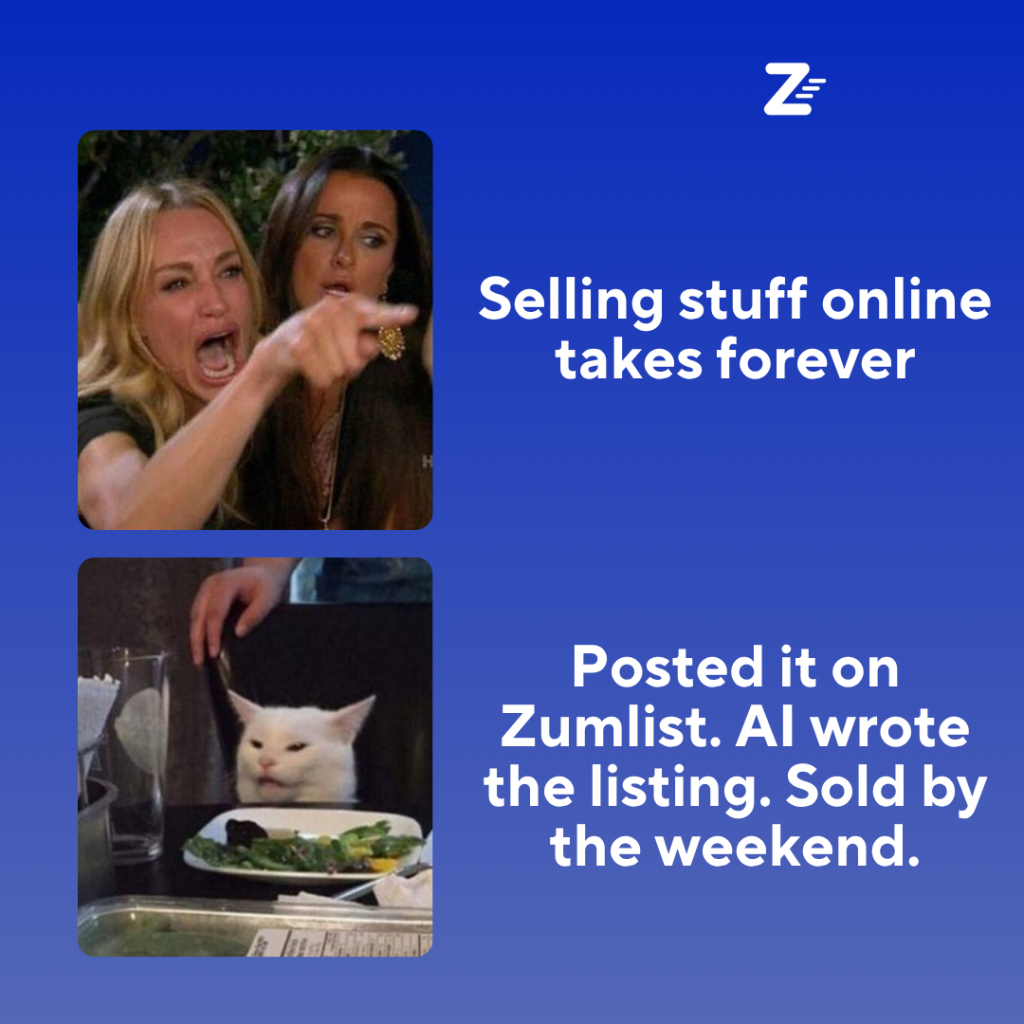
The meme format was built to disappear into the feed until it was too late to scroll past. It used a low-barrier, content-style approach so the ad did not feel too polished or promotional. The goal was to make people stop because it felt familiar, not because it looked like a traditional app ad.
📱The product demo direction
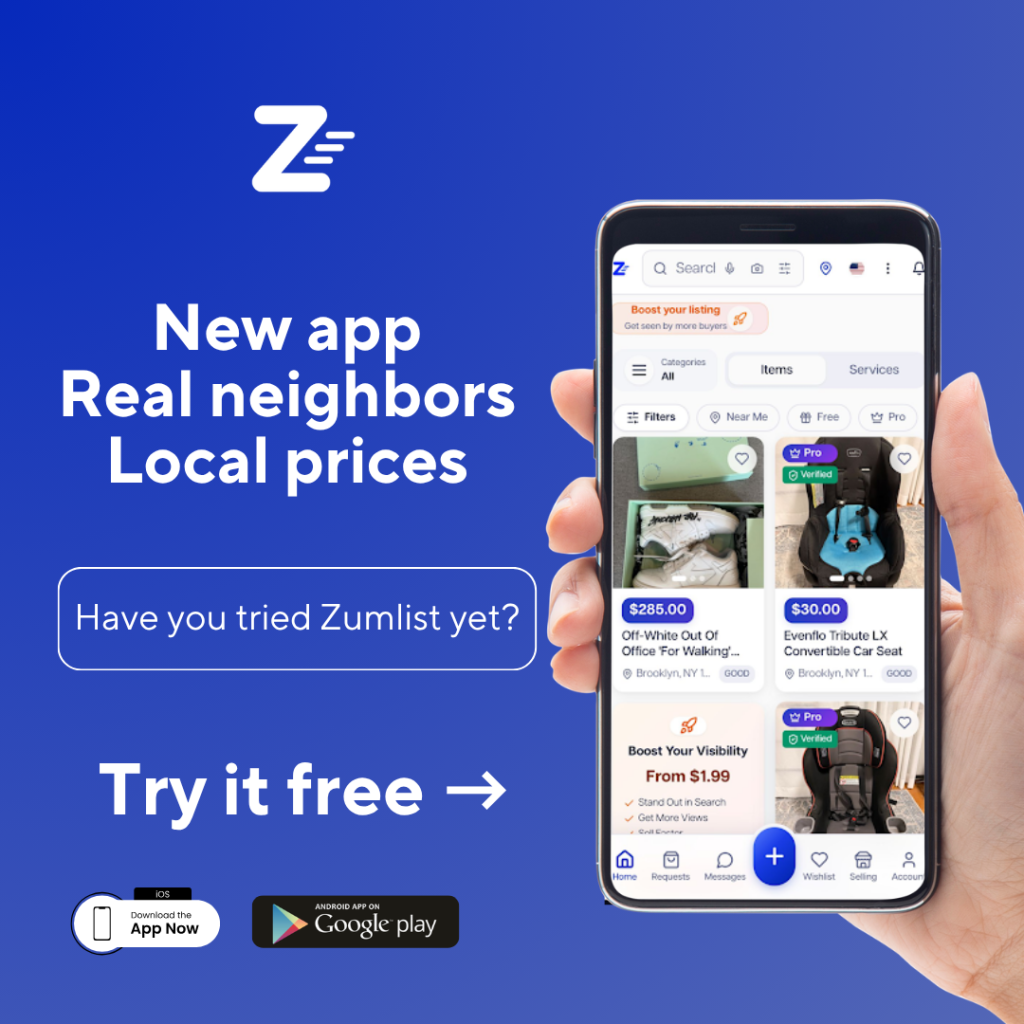
The product demo showed the app interface in action. This creative helped people understand what the app looked like and how they could browse, list, or book through Zumlist. For a new marketplace app, this kind of clarity matters because people often need to see the product before they trust it.
✨Aspirational
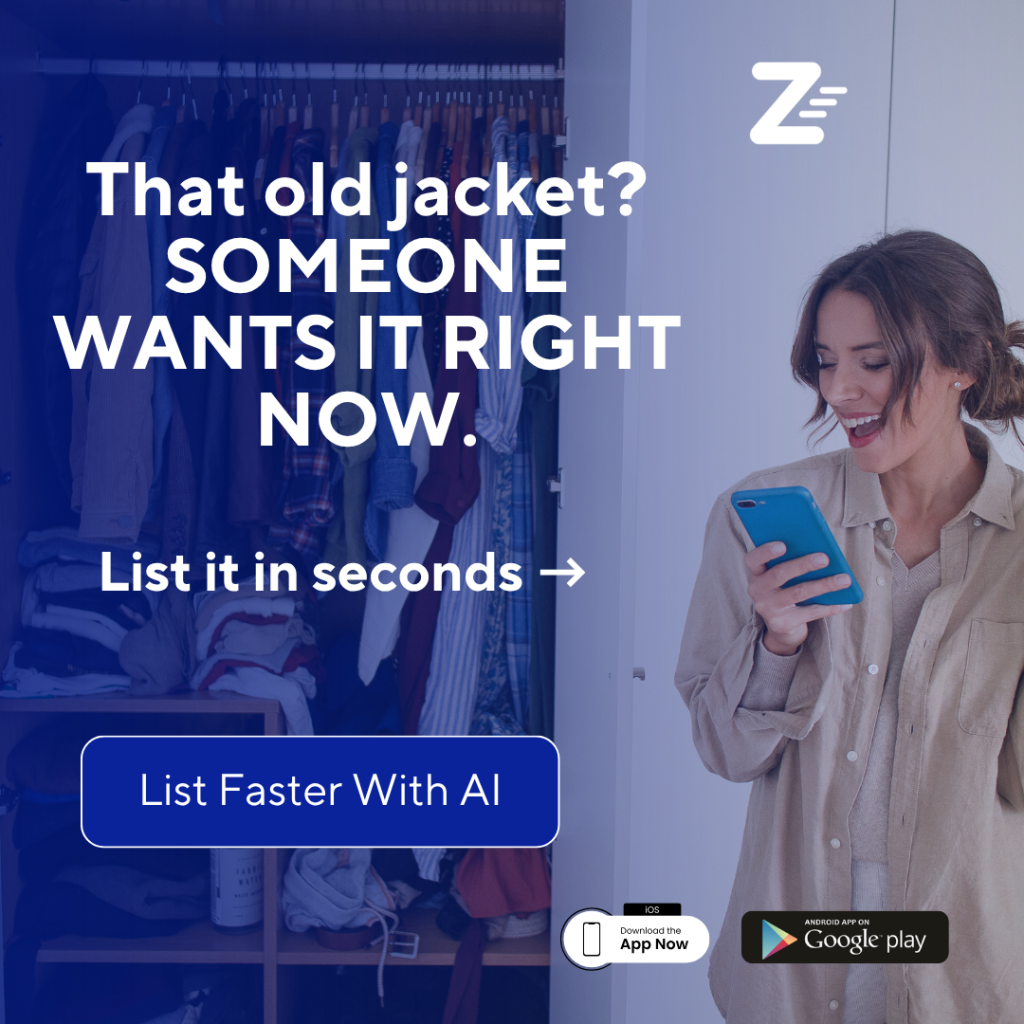
The aspirational angle focused on what users could gain. For sellers, that meant getting value from unused items or reaching the right person faster. For buyers, it pointed toward convenience, local access, and solving a problem without wasting time.
💰Price-Based
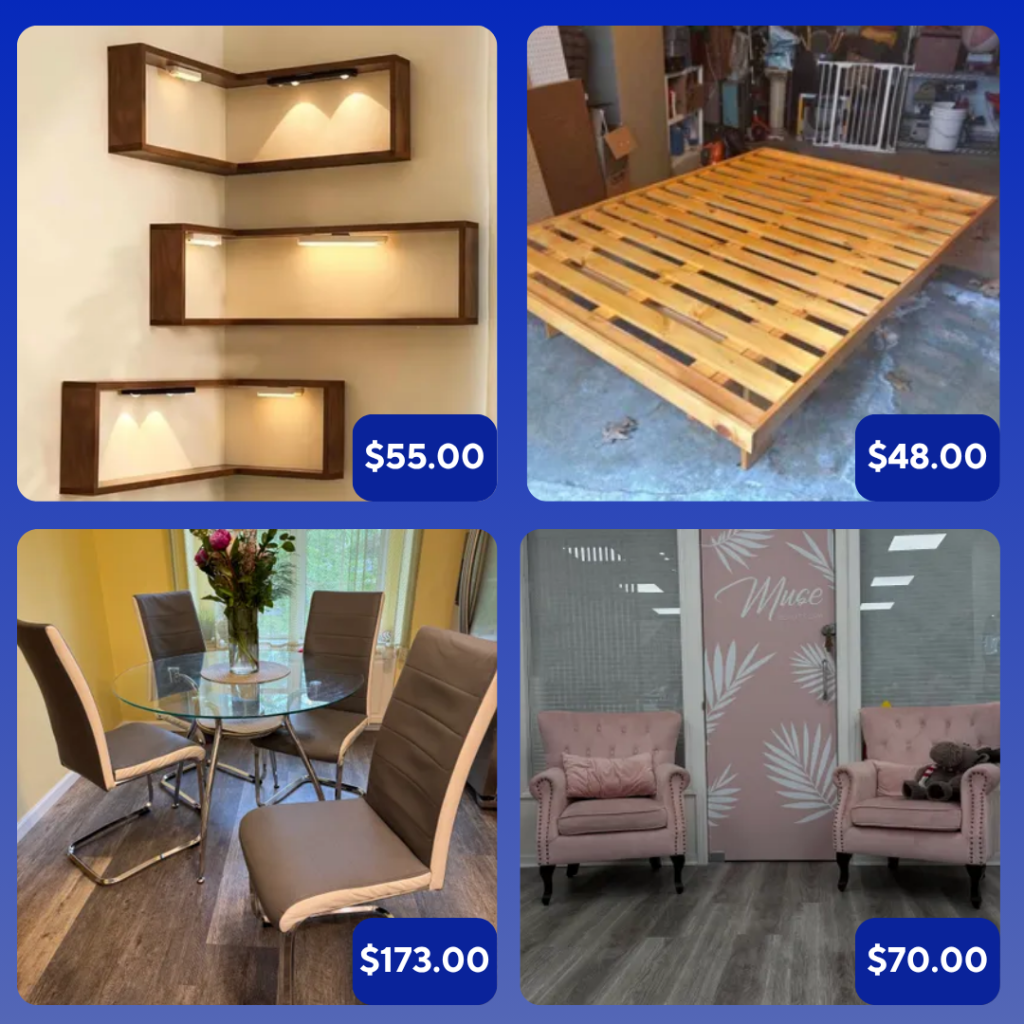
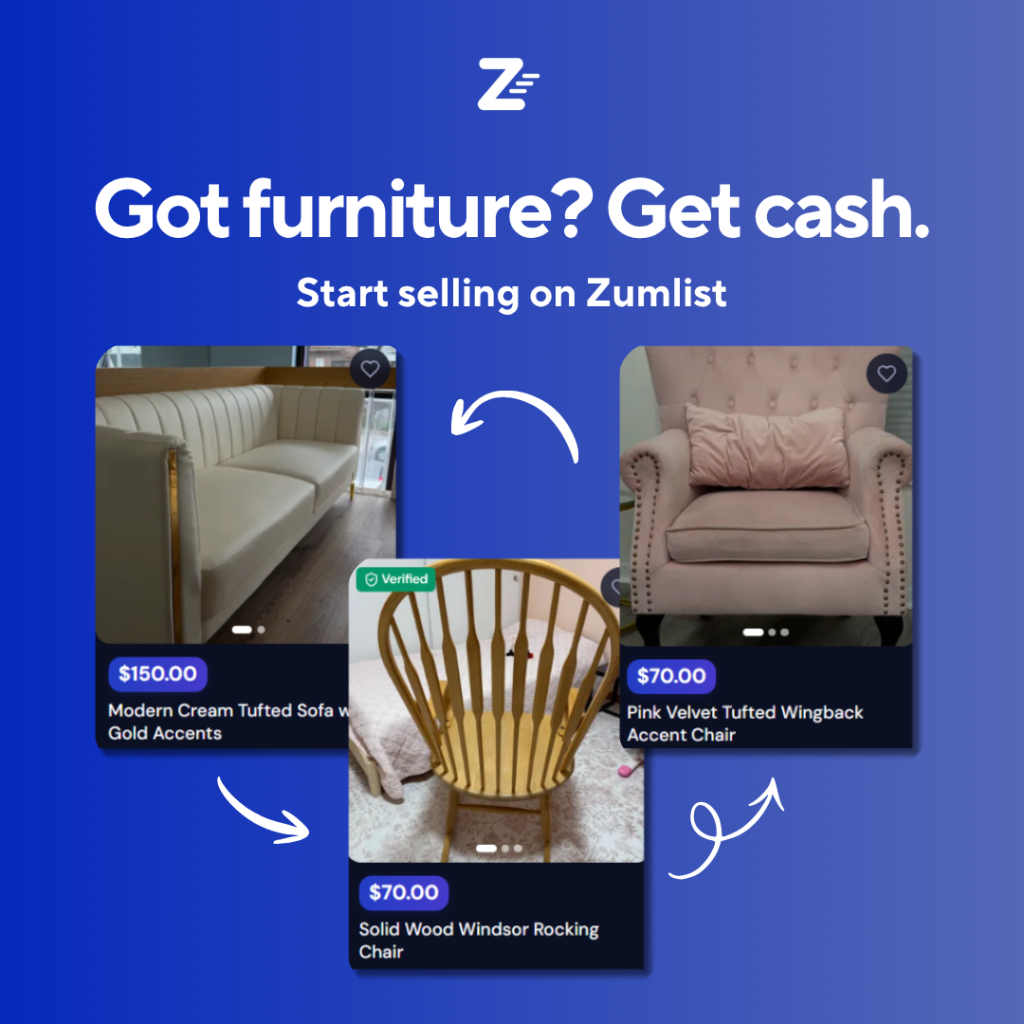
The price-based angle anchored the platform around value. It showed listings and pricing to make the benefit feel concrete. Instead of saying “local marketplace,” it showed what kind of deals or opportunities might exist inside the app.
⚡FOMO/Direct angle
The FOMO/Direct angle targeted people who like being first. It encouraged people to get on the platform before it became crowded and positioned Zumlist as a new local place to buy, sell, and get cash. Testing all five angles gave the campaign more relevance than simply changing colors, headlines, or layouts on one basic idea.
🧩Why One Message Couldn’t Speak to Both Audiences
One message could not speak to both audiences because buyers and sellers enter the app with different needs. Buyers want to find something. Sellers want to get discovered. Those are connected inside the product, but they require different reasons to install.
When buyer and seller messaging were mixed together, the value proposition became less clear. The ad had to work too hard, and the user had to figure out which part applied to them. That kind of confusion is expensive in mobile app advertising because people decide quickly whether an app is worth installing.
Keeping each creative focused on a single audience made the communication stronger. A buyer creative could focus on browsing, local prices, and useful listings. A seller creative could focus on posting faster, earning money, and reaching local demand. That clarity aligned better with Meta’s optimization because every install signal was tied to a cleaner message.
📊What the Campaign Data Told Us
The data showed three important things. First, iOS was clearly outperforming Android. Second, the combined setup gave Meta enough learning signal to find cheaper installs. Third, one creative eventually stood out so strongly that Meta pushed almost all video budget into it.
At the campaign level, iOS delivered the installs while Android did not justify continued spend.
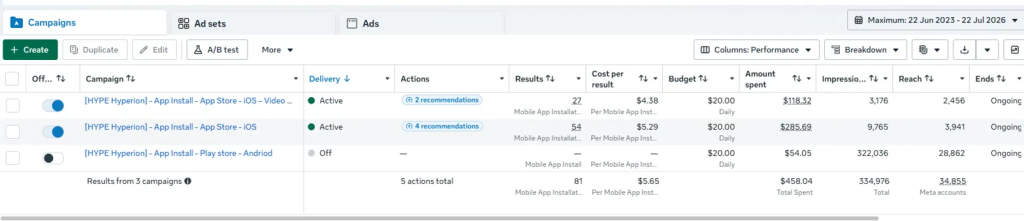
| Campaign | Installs | Cost Per Install | Spend |
| iOS — Video Ads | 27 | $4.38 | $118.32 |
| iOS — App Store (Image) | 54 | $5.29 | $285.69 |
| Android — Play Store | — | — | $54.05 |
| Total | 81 | $5.65 | $458.04 |
The iOS campaigns delivered 81 installs combined from $458.04 in total spend. Android spent $54.05 and produced nothing meaningful, which confirmed the platform decision. The best campaign-level CPI came from the iOS video campaign at $4.38 per install.
At the ad set level, the data showed how sensitive app install campaigns can be when the budget gets split too thinly.
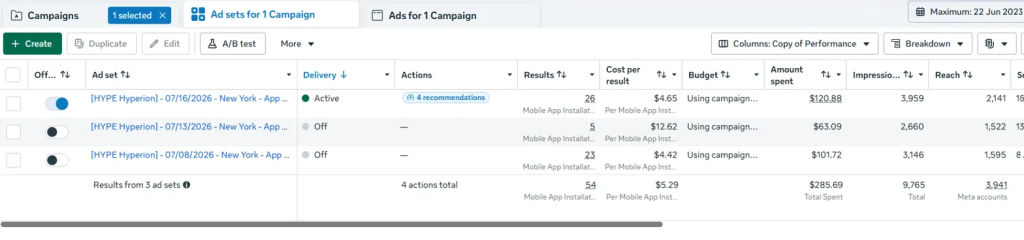
| Ad Set | Installs | Cost Per Install | Spend |
| 07/08/2026 | 23 | $4.42 | $101.72 |
| 07/13/2026 | 5 | $12.62 | $63.09 |
| 07/16/2026 (Active) | 26 | $4.65 | $120.88 |
The 07/08 ad set performed well at $4.42 per install. Then the 07/13 test spiked to $12.62 CPI after the campaign was split into three separate creative tests. Once the campaign was consolidated again, the active 07/16 ad set returned to a healthier $4.65 CPI with 26 installs.
At the ad level, Meta’s decision was even clearer.
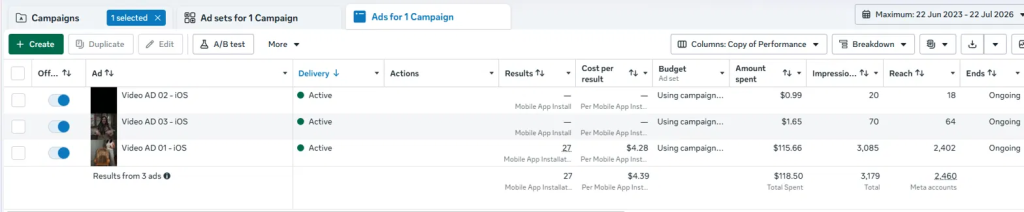
| Ad | Installs | Cost Per Install | Spend |
| Video AD 01 — iOS | 27 | $4.28 | $115.66 |
| Video AD 02 — iOS | — | — | $0.99 |
| Video AD 03 — iOS | — | — | $1.65 |
Meta allocated almost all budget to Video AD 01 immediately. Video AD 02 and Video AD 03 received almost no spend, which showed that the platform was already detecting a stronger performance signal from the first video. Video AD 01 produced 27 installs at $4.28 per install, making it the best individual creative in the account.
🧪The Experiment That Nearly Tripled Our Cost Per Install
Midway through the campaign, the team split the budget across three separate creative tests to isolate performance. It looked like the right call. The data disagreed. We wanted to isolate performance, understand which creative was winning, and avoid relying only on blended campaign data.
But the data showed the downside quickly.
When the campaign was split, the cost per install jumped from around the $4 range to $12.62. That was not because the audience suddenly became bad or the app became less attractive. It happened because the budget was fragmented across separate tests, giving each ad less data and weakening Meta’s learning signals.
This matters because the learning phase needs enough conversion volume to optimize properly. When spend is split too thinly, the algorithm has less room to learn, fewer installs to evaluate, and more uncertainty in delivery. The result is often higher costs, even when the creative itself is not the problem.
Once the campaign was consolidated back into the combined setup, performance recovered. CPI dropped back to $4.65 in the active ad set. That told us the campaign did not need more fragmentation. It needed enough budget density for Meta to keep optimizing around the strongest install signals.
🤖Meta Identified the Winning Creative Before We Did
The ad-level data made one thing obvious: Meta identified the winning creative almost immediately.
Video AD 01 received $115.66 in spend and produced 27 installs at $4.28 CPI. Video AD 02 received only $0.99. Video AD 03 received only $1.65. That was not a delivery issue. That was the meta algorithm reacting to early performance signals.
This is where algorithmic optimization can be useful when the campaign structure is clean. Meta saw that Video AD 01 had the strongest chance of driving installs and moved the budget there faster than a manual test would have. Forcing equal spend across all three videos would have cost more money just to arrive at a conclusion Meta had already reached with $2 of test budget.
The lesson is not to hand the wheel to the algorithm and walk away. The lesson is to give Meta the right structure, clean tracking, and clear creative options. When the signal is strong, the platform can identify the winner quickly. In this case, the best move was to trust the signal and use Video AD 01 as the foundation for the next scaling phase.
Video AD Example:
💡Lessons We’ll Carry Into Every Future App Install Campaign
- The first lesson is that tracking comes before scale. If the SDK is not implemented properly, conversion tracking becomes unreliable, and the campaign is forced to optimize with weak data. For mobile app advertising, that is one of the fastest ways to waste budget.
- The second lesson is to choose platforms based on data, not assumptions. Android was tested, but the results did not support continued spend. iOS delivered the better install volume, better CPI, and stronger signal for the New York launch market, so the budget moved there.
- The third lesson is that marketplace apps need audience-specific messaging. Buyers and sellers may exist inside the same app, but they do not care about the same benefit. Separating the creative by user intent made every message clearer.
- The fourth lesson is to avoid unnecessary budget fragmentation. Splitting creatives can feel logical when you want cleaner manual testing, but it can damage Meta’s learning phase if the budget is too thin. In this campaign, consolidation outperformed fragmentation.
Right now, the campaign stands at 81 total installs from $458.04 in spend, with a blended $5.65 cost per install. The best individual video creative produced installs at $4.28, iOS remains active and optimizing, and Android has been turned off.
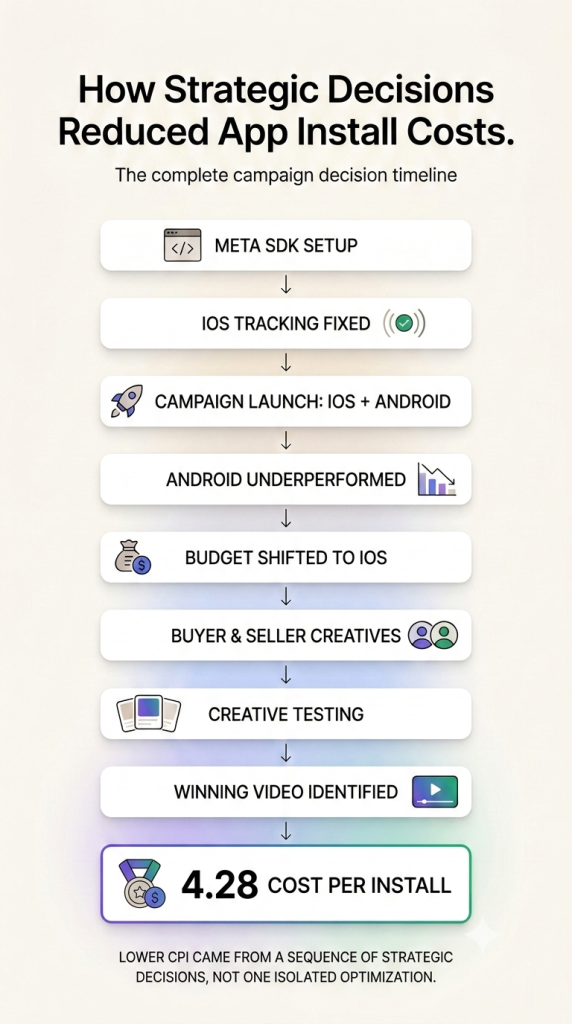
The next phase is not to rebuild the strategy from scratch. It is to scale what already worked: keep iOS as the primary platform, build around the winning video, maintain clean tracking, and expand beyond New York using the same audience-specific creative structure.
For future Meta App Install campaigns, the practical recommendation is simple: fix tracking first, let the data choose the platform, separate audience messages, avoid splitting budget too early, and scale the creative that Meta is already rewarding.